Remove Analysis Remove Commerce Remove KPI Remove Learning
article thumbnail

11 Competitor KPIs Every Brand Should Track – Part 1

Data Hut

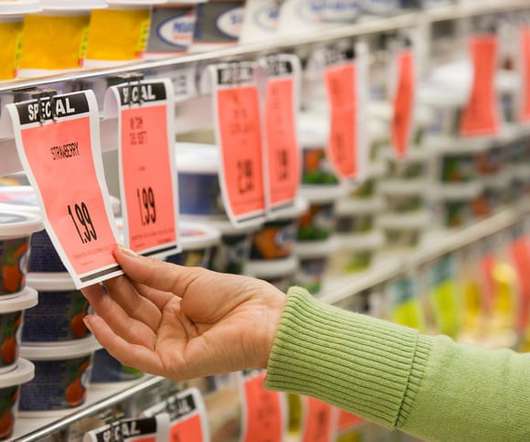
But on a more focused perspective, KPIs have specifically selected data points relevant to the progress of a goal. . Thereupon, you will run campaigns and learn how it impacts your ROI. These same factors that you use to track a goal (the goal being increased ROI) become your KPIs. KPI #1: Price tracking.

KPI 98
article thumbnail

Take Control of Your Brand with Direct-to-Consumer (D2C)

Evalueserve

PepsiCo launched two new D2C e-Commerce Web Properties in 2020: PantryShop.com & Snacks.com. Nike has also invested heavily in its D2C initiatives over the past few years by improving its e-commerce website and the NikePlus membership program. Reach customers on non-commerce platforms (social media, games, etc.).

Insiders

Sign Up for our Newsletter

This site is protected by reCAPTCHA and the Google Privacy Policy and Terms of Service apply.

article thumbnail

Call Center Dashboard – Reporting & Analytics In Our Data-driven World

Datapine Blog

A call center dashboard is an intuitive visual reporting tool that displays a range of relevant call center metrics and KPIs that allow customer service managers and teams to monitor and optimize performance and spot emerging trends in a central location. When considering how to build a contact center dashboard, communication is key.

KPI 80
article thumbnail

Clickless Analytics

Elegant BI

The other added solution is a self-learning bot which manages the analytics for you. More like an e-commerce site, one has to be given a choice to select a ready analytics or graph based on past analysis and intentions. We also understand the KPI of the user based on the profile.

article thumbnail

What Is The Difference Between Business Intelligence And Analytics?

Datapine Blog

Descriptive analytics : As its name suggests, this analysis method is used to describe and summarize the main characteristics found on a dataset. It relies on mathematical models, machine learning, and artificial intelligence technologies to make accurate predictions which makes them harder to use for an average user with no prior skills.

article thumbnail

Price testing: How to design a framework to maximize your profit

Data Hut

Also read: Coronavirus: Changing consumer behavior and e-commerce trends. Use the right metrics: Every goal is related to specific metrics or KPI. So, while collecting and studying these data points, keep in mind that a strategic combination of KPIs gives you the best result. . STEP 4: Perform result analysis.

KPI 52
article thumbnail

How Can Smart Data Discovery Tools Generate Business Value?

Datapine Blog

That said, there are data analysis tools that you can use to enhance your efforts. This level of discovery can be described and categorized by: Data preparation Visual analysis Guided advanced analytics. There are many KPI examples you could choose from, depending on your industry and/or department.