Remove Analysis Remove Commerce Remove KPI Remove Retail
article thumbnail

11 Competitor KPIs Every Brand Should Track – Part 1

Data Hut

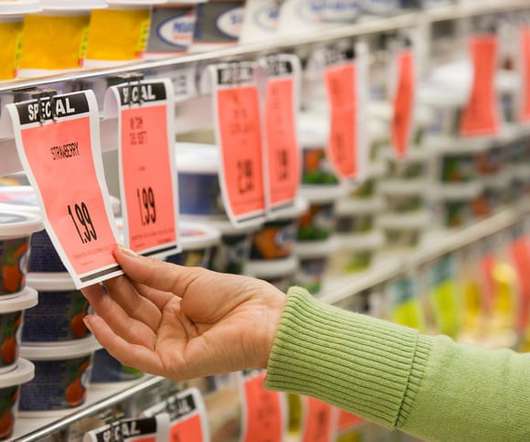
As a retailer, your journey moves only in the direction of growth. The insights you get through tracking competitor KPIs are crucial to a brand’s decision-making process. Let us look at a few of the most critical competitor KPIs. . KPI #1: Price tracking. KPI#2: Promotions tracking . promotions kpi. .

KPI 98
article thumbnail

Take Control of Your Brand with Direct-to-Consumer (D2C)

Evalueserve

Direct-to-Consumer (D2C) is a strategy in which a company markets and sells its products or services directly to its consumers, eliminating the need for intermediaries or 3rd parties, e.g., grocery stores, dealerships, retailers, etc. PepsiCo launched two new D2C e-Commerce Web Properties in 2020: PantryShop.com & Snacks.com.

Insiders

Sign Up for our Newsletter

This site is protected by reCAPTCHA and the Google Privacy Policy and Terms of Service apply.

article thumbnail

Price testing: How to design a framework to maximize your profit

Data Hut

Also read: Coronavirus: Changing consumer behavior and e-commerce trends. Several price comparison websites get data directly from retailers. Use the right metrics: Every goal is related to specific metrics or KPI. STEP 4: Perform result analysis. The best method to do so will be a variance analysis.

KPI 52
article thumbnail

What Is The Difference Between Business Intelligence And Analytics?

Datapine Blog

Descriptive analytics : As its name suggests, this analysis method is used to describe and summarize the main characteristics found on a dataset. However, this has been changing in the past years as new tools emerge that allow users to perform advanced analysis with just a few clicks. Let’s see a conceptual definition of the two.

article thumbnail

How Can Smart Data Discovery Tools Generate Business Value?

Datapine Blog

That said, there are data analysis tools that you can use to enhance your efforts. This level of discovery can be described and categorized by: Data preparation Visual analysis Guided advanced analytics. There are many KPI examples you could choose from, depending on your industry and/or department.

article thumbnail

Discover 20 Essential Types Of Graphs And Charts And When To Use Them

Datapine Blog

That said, the type of chart or graph you use will vary depending on the aim of the analysis. Try our 14-day trial & benefit from visual data analysis today! 1) Number Chart When to use A real-time number chart is essentially a ticker that will give you an immediate overview of a particular KPI.

KPI 71