article thumbnail

Data Visualization for Marketers: Do’s, Dont’s, and 6 Expert Tools

CXL

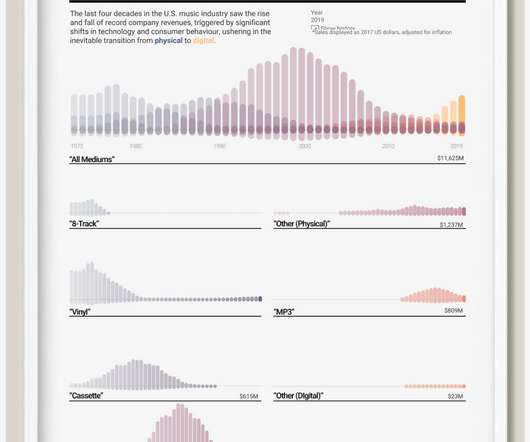
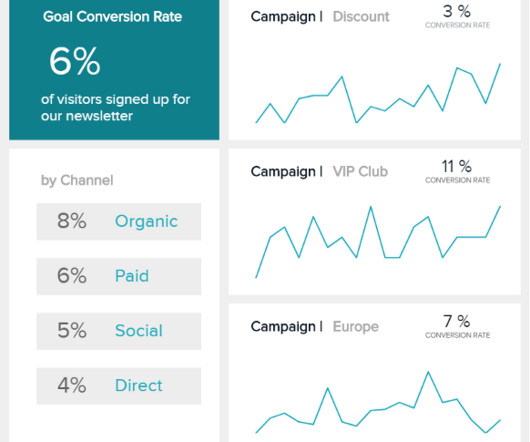
Bar graphs, pie charts, and matrices are data visualization tools that reveal trends and key findings in an understandable and engaging format. In this article, you’ll learn how to use data visualization to scale your organization through partner networks, sales enablement, and product-led content.

article thumbnail

Getting Started With Incremental Sales – Best Practices & Examples

Datapine Blog

In that sense, incremental sales analysis can present a huge competitive advantage for businesses as it provides the necessary knowledge to analyze the effectiveness and performance of different activities such as affiliate marketing, paid ads, influencer marketing, and many others.

Sales 70
article thumbnail

10 Types of Sales Data Growing Sales Teams Need to Track

Zoominfo

Here’s how to make sales data work for you. What is Sales Data? Sales data is a broad category of business intelligence that encompasses everything about the sales process and gives individuals and leaders a way to view and optimize their performance.

Sales 130