Remove Algorithm Remove Business Intelligence Remove Human Resources Remove KPI
article thumbnail

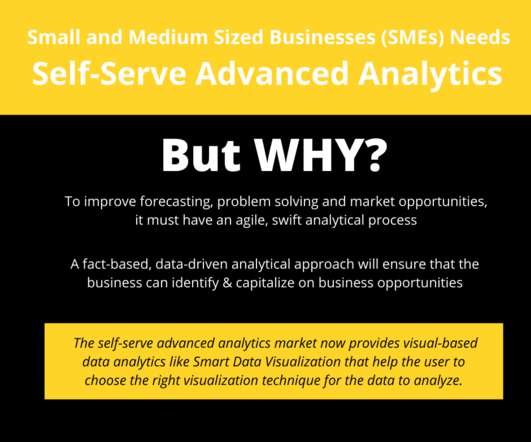
Small and Medium Sized Businesses (SMEs) Needs Self-Serve Advanced Analytics!

Elegant BI

A recent Gartner report states that, natural language processing and conversational analytics will boost analytics and business intelligence adoption from 35% of employees to over 50%, including new classes of users, particularly front-office workers.

article thumbnail

Get The Most Out Of Smart Business Intelligence Reporting

Datapine Blog

Spreadsheets no longer provide adequate solutions for a serious company looking to accurately analyze and utilize all the business information gathered. That’s where business intelligence reporting comes into play – and, indeed, is proving pivotal in empowering organizations to collect data effectively and transform insight into action.

Insiders

Sign Up for our Newsletter

This site is protected by reCAPTCHA and the Google Privacy Policy and Terms of Service apply.

article thumbnail

Get Started With Interactive Weekly Reports For Performance Tracking

Datapine Blog

Typically, weekly status reports are used to track progress or performance for different business scenarios, such as projects, sales, finances, marketing campaigns, human resources, or any other area that might be relevant. Like this, you will save time and resources by creating data-backed campaigns. click to enlarge**.

KPI 88
article thumbnail

What Is Ad Hoc Reporting? Your Guide To Definition, Meaning, Examples & Benefits

Datapine Blog

If utilized correctly, data offers a wealth of opportunity to individuals and companies looking to improve their business’ intelligence, operational efficiency, profitability, and growth over time. This is not only critical in business intelligence but, as we have seen, in other areas such as education or government services.

article thumbnail

Dashboard Storytelling: From A Powerful To An Unforgettable Presentation

Datapine Blog

But for optimum effectiveness, we still need more than a computer algorithm – here, we need a human to present the data in a way that will make it meaningful and valuable. Business dashboards are now driving forces for visualization in the field of business intelligence. Put your audience first.