article thumbnail

Python for Machine Learning: A Tutorial

IT Business Edge

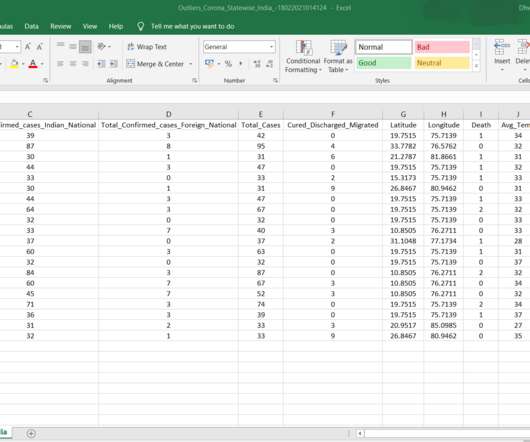
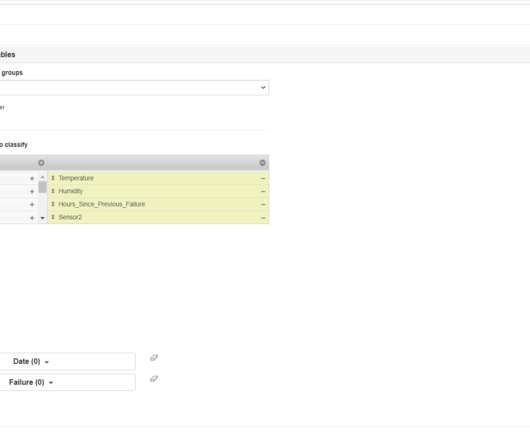
Jump to: Machine Learning 101 Python Libraries and Tools Training a Machine Learning Algorithm with Python Using the Iris Flowers Dataset. Machine learning (ML) is a form of artificial intelligence (AI) that teaches computers to make predictions and recommendations and solve problems based on data. Machine Learning 101. Model training.

article thumbnail

13 power tips for Microsoft Power BI

CIO

Power BI is Microsoft’s interactive data visualization and analytics tool for business intelligence (BI). With Power BI, you can pull data from almost any data source and create dashboards that track the metrics you care about the most. Power BI’s rich reports or dashboards can be embedded into reporting portals you already use.

Matrix 793
Insiders

Sign Up for our Newsletter

This site is protected by reCAPTCHA and the Google Privacy Policy and Terms of Service apply.

article thumbnail

Customer Churn Model Using Smarten Assisted Predictive Modelling!

Elegant BI

With Smarten Insights, the user will simply have to select the dataset to be analyzed and the broad category of the algorithm to be applied. In order to select the best category of algorithm, users need to have some basic data literacy. In order to select the best category of algorithm, users need to have some basic data literacy.

article thumbnail

Handling Outliers Using Smarten Assisted Predictive Modelling!

Elegant BI

Smarten Insight provides predictive modeling capability and auto-recommendations and auto-suggestions to simplify use and allow business users to leverage predictive algorithms without the expertise and skill of a data scientist. 10. Better data beats fancier algorithms. Become one with the data!

article thumbnail

Machine Maintenance Using Smarten Assisted Predictive Modelling!

Elegant BI

Smarten Insight provides predictive modelling capability and auto-recommendations and auto-suggestions to simplify use and allow business users to leverage predictive algorithms without the expertise and skill of a data scientist. In order to select the best category of algorithm, users need to have some basic data literacy.

article thumbnail

Data Visualization for Marketers: Do’s, Dont’s, and 6 Expert Tools

CXL

The magic quadrant, often called the 2×2 matrix or the four-blocker, is great for reporting differences (i.e. Gartner’s magic quadrant is an example of a branded 2×2 matrix that plots a company’s ability to execute against its completeness of vision. The magic quadrant. opposites) or data points across two ranging scales.

article thumbnail

Top 10 Analytics And Business Intelligence Trends For 2020

Datapine Blog

Over the past decade, business intelligence has been revolutionized. Spreadsheets finally took a backseat to actionable and insightful data visualizations and interactive business dashboards. 2019 was a particularly major year for the business intelligence industry. Source: Business Application Research Center *.