

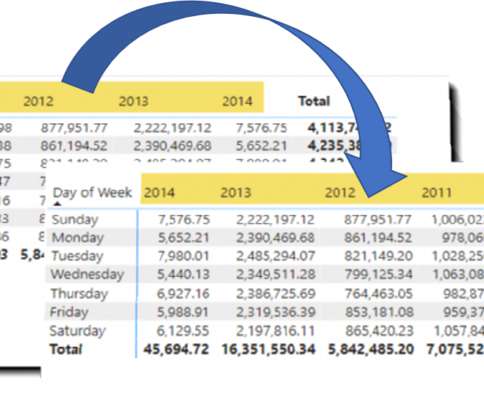
Quick Tips: How to Sort Matrix by Column in Descending Order
BI Insight
MARCH 11, 2020
Today Microsoft released Power BI Desktop March 2020 which I was hoping that it includes a simple feature on Matrix visual to be able to sort the Martix by column in descending order, but, it doesn’t. So, in this post I quickly show you how to sort Matrix by column in descending order.


Let's personalize your content