
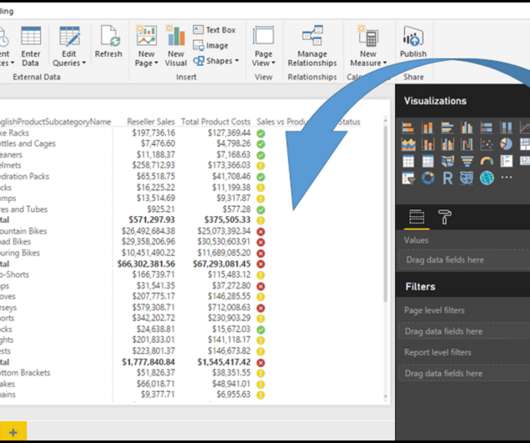
Use KPI in Table, Matrix and Card Visualisations in Power BI
BI Insight
OCTOBER 30, 2016
In this post I show you a very simple way to import KPIs and use them in Table, Matrix, Multi-row … Continue reading Use KPI in Table, Matrix and Card Visualisations in Power BI. The post Use KPI in Table, Matrix and Card Visualisations in Power BI appeared first on BI Insight.


Let's personalize your content