Remove Commerce Remove Data Analysis Remove KPI Remove Technology
article thumbnail

Master Salesforce Reports With Modern Reporting Tools – Examples And Templates

Datapine Blog

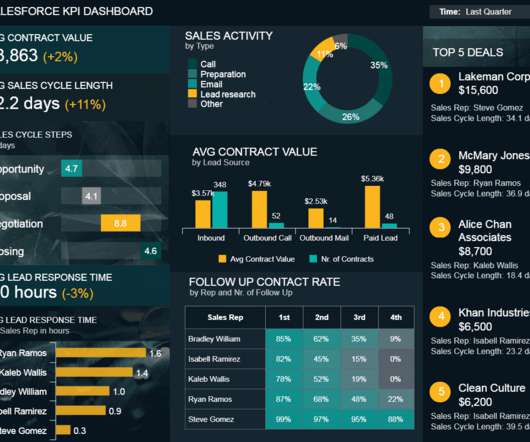
Salesforce report is a management tool that offers a visual representation of essential sales-based data through a centralized cloud-based reporting platform with the goal to enhance critical elements of a business, including marketing, sales, commerce, and service. 2) Set your KPIs . Salesforce KPI Dashboard.

KPI 64
article thumbnail

Call Center Dashboard – Reporting & Analytics In Our Data-driven World

Datapine Blog

As the data is presented in an interactive, intuitive, and visual format, it’s possible to view, absorb, analyze, and share vital data with ease, saving time and aiding cross-departmental collaboration. Primary KPIs. Customer Support KPI Dashboard. Primary KPIs: Tickets & Ticket-Status. Zendesk KPI Dashboard.

KPI 80
Insiders

Sign Up for our Newsletter

This site is protected by reCAPTCHA and the Google Privacy Policy and Terms of Service apply.

article thumbnail

What Is The Difference Between Business Intelligence And Analytics?

Datapine Blog

Predictive analytics : This method uses advanced statistical techniques coming from data mining and machine learning technologies to analyze current and historical data and generate accurate predictions. For example, let’s say that your hypothetical e-commerce store sold boutique women’s fashion.

article thumbnail

How Can Smart Data Discovery Tools Generate Business Value?

Datapine Blog

The ability to discover as well as analyze patterns and trends within data sets enables businesses to provide themselves with a competitive edge, meet business goals, ensure success, and remain relevant in the digital era. That said, there are data analysis tools that you can use to enhance your efforts. 2) Be quick.