
It’s a question that companies have struggled to answer since the dawn of capitalism... “Is the money we spend on marketing generating any ROI?”
This timeless question has struck fear in the hearts of many B2B marketing managers throughout the ages, not because they don’t believe they bring value, but because they struggle to deliver the data that proves they bring value.
Thanks to HubSpot attribution reporting, inbound marketers don’t need to panic when that all-important question comes their way. With Multi-Touch Revenue Attribution reporting, you can bring instant clarity and insights into which content, campaigns, and specific digital marketing efforts actually generate revenue and where to focus your efforts.
HubSpot’s Multi-Touch Revenue Attribution reports help you better understand how various marketing and sales activities generate revenue for your business through marketing ROI analysis.
Think of it like this: Customers are assigned “credits” in your HubSpot CRM, each of which are tied to the activities they’ve taken during each interaction with your company’s website, marketing campaigns, and sales outreach. Once they’ve entered the closed/won stage, you’ll be able to look back to see precisely how and where they engaged with your content and what led them to placing that all-important order or signing a contract.
An important note: This type of reporting requires a HubSpot Marketing Hub Enterprise license and requires that you’re tracking Deals with closed-loop revenue data entered in HubSpot for the specific contacts that have progressed from Contacts to Closed customers. To learn more about how to create these reports, check out the HubSpot Knowledge Base.
LEARN MORE: 6 Great HubSpot Features You Might Not Know About
There are several types of HubSpot attribution reports you can leverage as part of your B2B marketing analytics tools, each providing different perspectives and insights. At its core, any reporting strategy — HubSpot or otherwise — comes down to figuring out which question(s) you’re trying to answer. From there, you can determine the best Multi-Touch Revenue Attribution model to use.
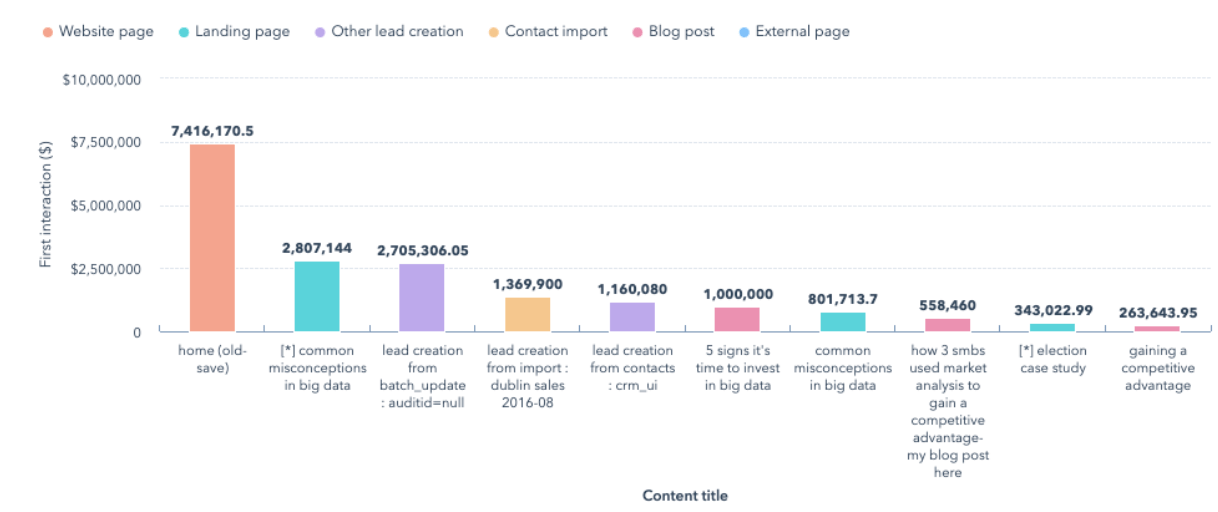
What was the very first interaction with contacts who became customers? Was it your homepage, a case study, or maybe a blog? The First Touch Attribution report attributes 100% of the credit to a customer’s first touch at the top of the sales funnel. This is the content that drives visitors to your site.
Source: HubSpot
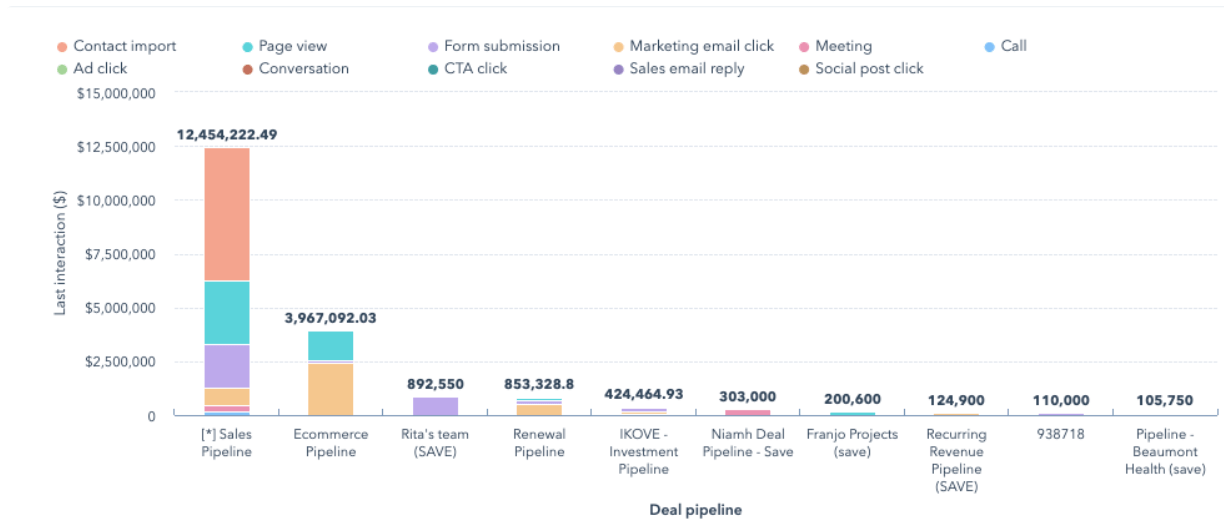
Perhaps just as important as knowing what first brought a customer to your doorstep is knowing what it was that closed the deal. This report attributes 100% of the credit to a contact’s very last interaction before becoming a customer. This bottom-of-the-funnel action could include a call with a sales rep, a product demo, or maybe even a facility tour.
Source: HubSpot
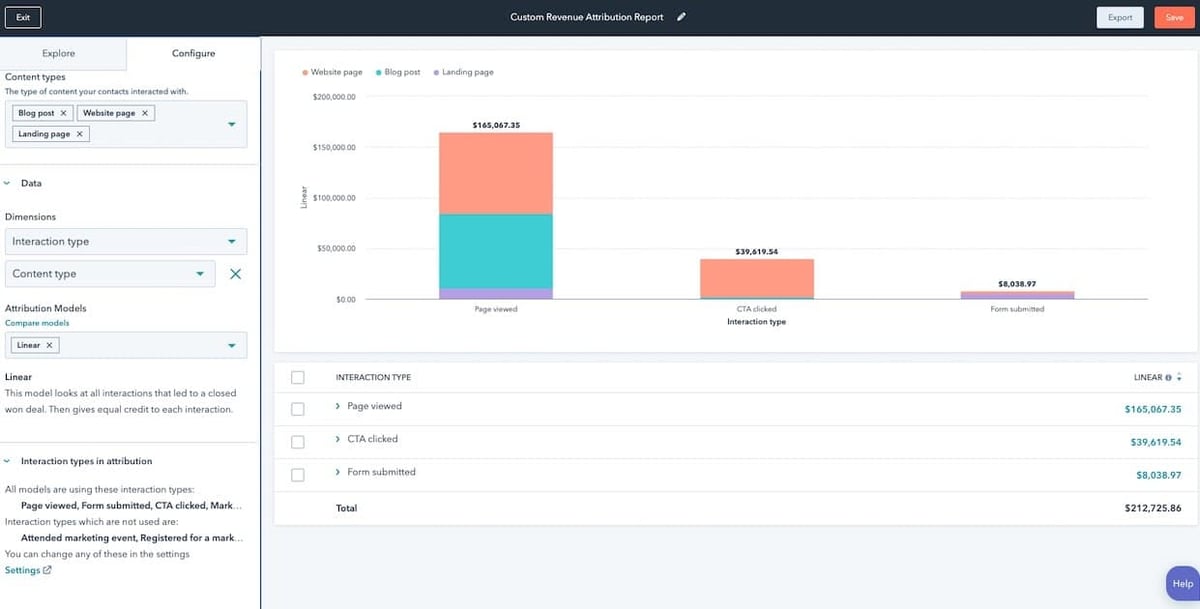
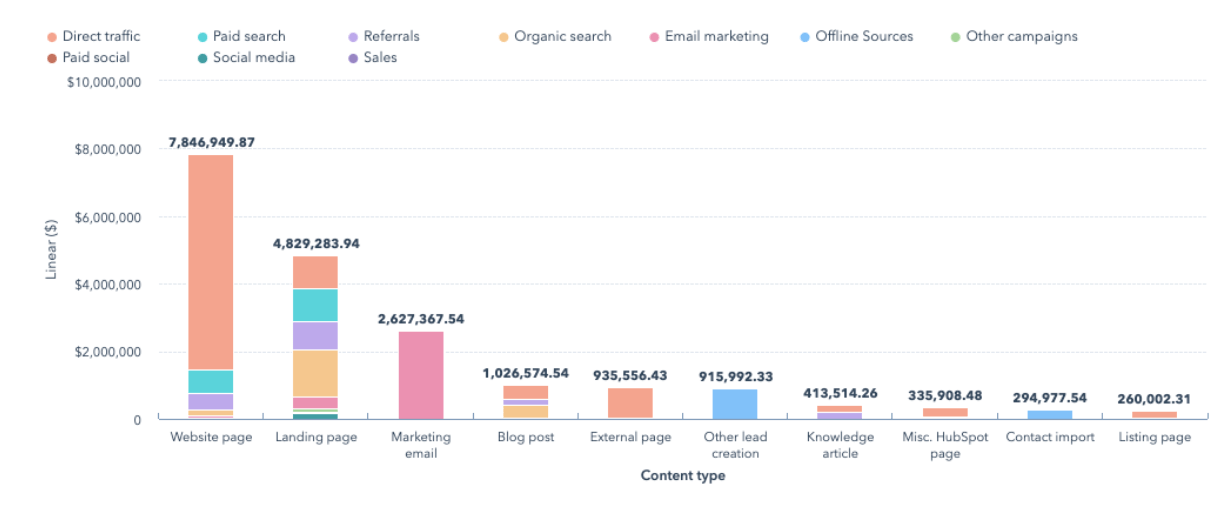
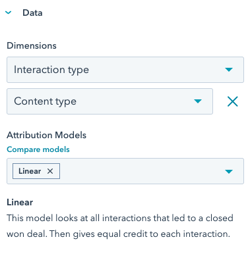
Of course, there are typically many steps between the first and last interactions with clients. Linear Attribution divides revenue among them all and helps you see how contacts interacted with your content along the path toward becoming a customer. You can know which pieces of content are most valuable and keep prospects engaged as they move down the sales funnel. That’s the content you want to keep fresh and optimized.
Source: HubSpot
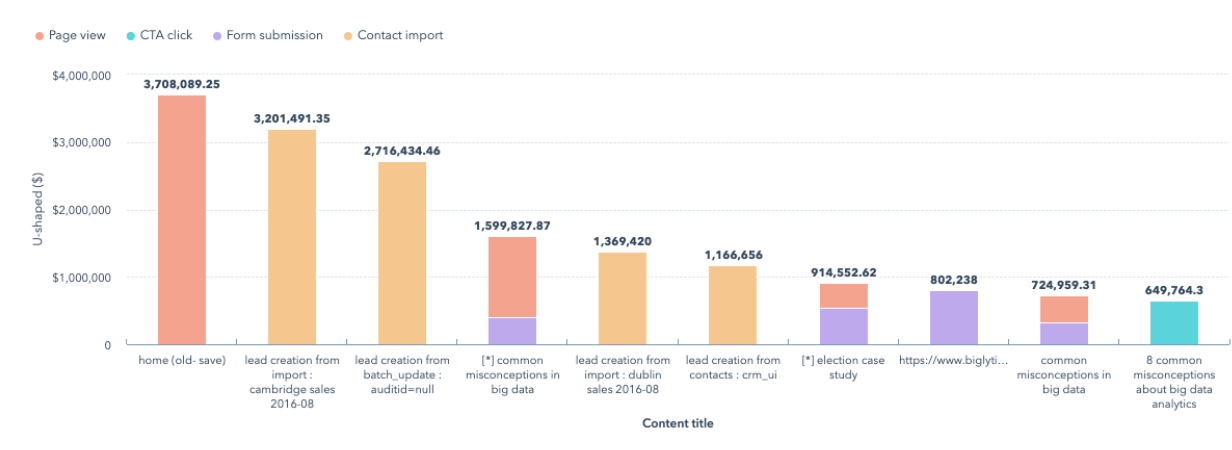
A U-Shaped Attribution report assigns 80% of the credit to a contact during their first interactions with you up until they become a lead in your CRM, with 40% going toward the first interaction and 40% going toward the last step someone took before becoming a lead. The remaining 20% is assigned to other interactions in between. This report helps outline the first half of the customer buyer’s journey — the steps a customer took that first led them to fill out a conversion form and become a lead in your system.
Source: HubSpot
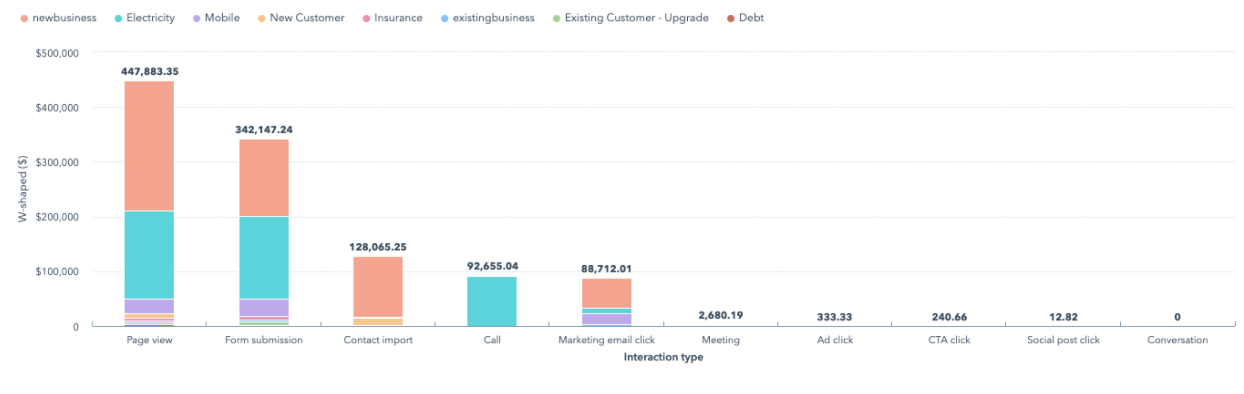
Here, 90% of the revenue is distributed evenly between the first interaction, lead creation, and deal creation, helping to provide a broader view of the handoff between marketing and sales. The remaining 10% is assigned to other touchpoints between the first interaction and deal creation.
Source: HubSpot
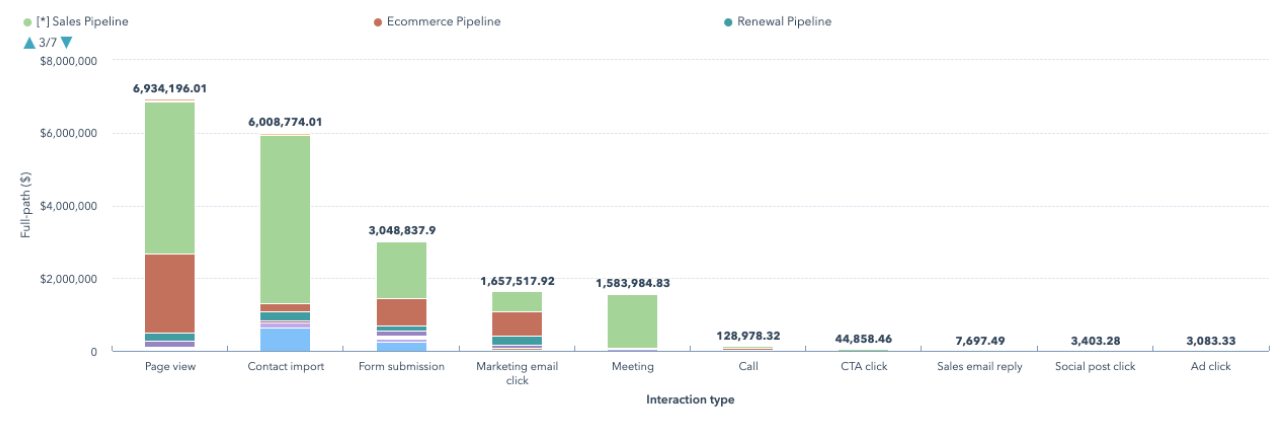
As its name suggests, this model provides a broader view of the buyer’s journey. It’s especially helpful for complex B2B organizations with lengthy sales cycles and the negotiation period between when a deal is created and when it’s closed. In all, 90% of the revenue credit is distributed equally among the four most significant interactions, with the remaining 10% being split among the rest.
Source: HubSpot
Time Decay reports get a bit more granular regarding the interactions that happen just prior to the all-important first conversion that moves a contact into your CRM. Knowing how a customer interacted in the days leading up to a conversion can help you know where to focus your relationship-building and nurturing efforts. The credit is assigned based on timing: an interaction that happens the day before a conversion receives more credits than one that happened a week earlier.
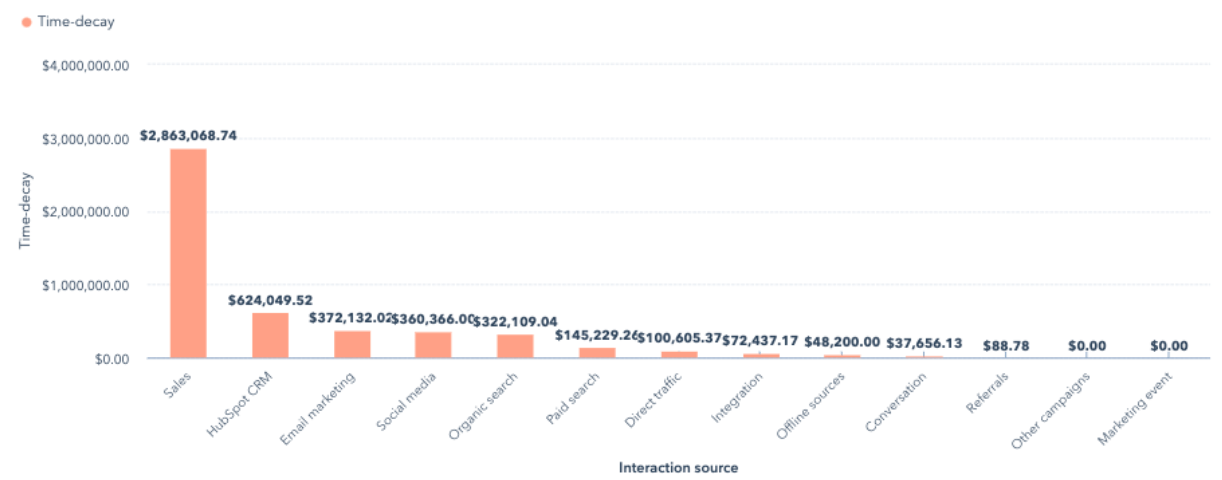
Source: HubSpot
Also Read: 5 Top HubSpot Contact Attribution Reports That Content Marketers Need to Know
In addition to the attribution models above, use the filters and data configuration options within HubSpot’s report builder for Campaigns, Deal Type, Pipeline, Interaction Type and Content Type to drill down even further and identify what’s working. With these options you can answer questions that have long been pain points for marketers, such as:
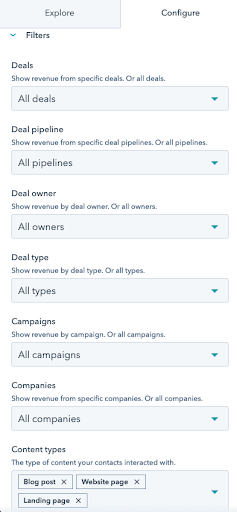
Pro tip: You can customize the Interaction types that pull into your reports in your HubSpot settings if there are certain activities you want to exclude or include.
These additional filters can prove invaluable when planning future campaigns and content so that you’re focusing on efforts that have proven to bring the greatest results.
Multi-Touch Revenue Attribution models help Enterprise-level HubSpot partners pinpoint with incredible accuracy the interactions and content marketing efforts that are truly most valuable as part of the sales process. It’s just one of many reasons to use HubSpot as part of your inbound growth strategy.
Check out all the other reasons in our Why Go HubSpot guide, and reach out if you’d like to talk through leveraging the platform for your sales and marketing efforts.