Get a God's-eye View of European Markets
Alternative Data Insights for European Investors: Real-World Use Cases.
Alternative Data for European Investors
As economic activity comes online, new data trails are left behind. The most innovative investors leverage this data for alpha-generating insights. Thinknum’s alternative datasets power investment decisions across companies listed in all major European exchanges.
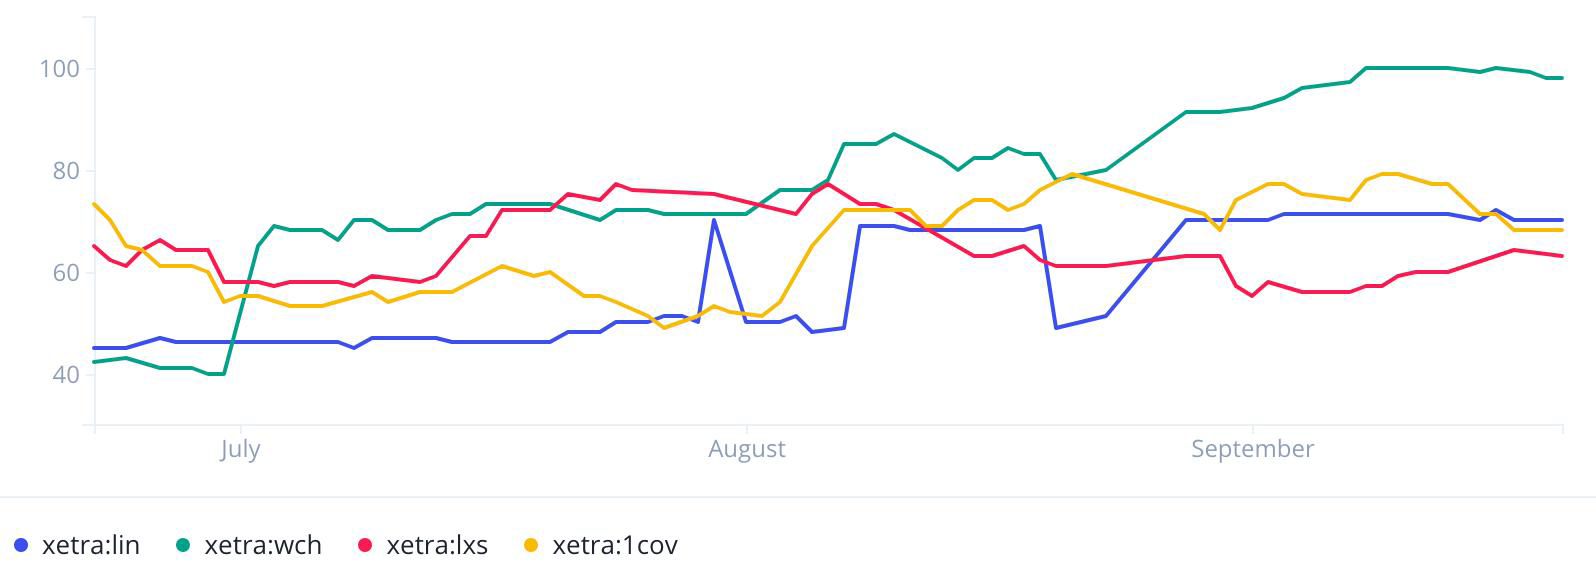
Chemical Companies: Compare Job Openings on Xetra
Savvy investors look to hiring data as a valuable leading indicator of future corporate performance. View the number of open job listings at Lanxess and Linde in real-time, for example. Filter to gain in depth competitive insights into specific market, location, and job categories.
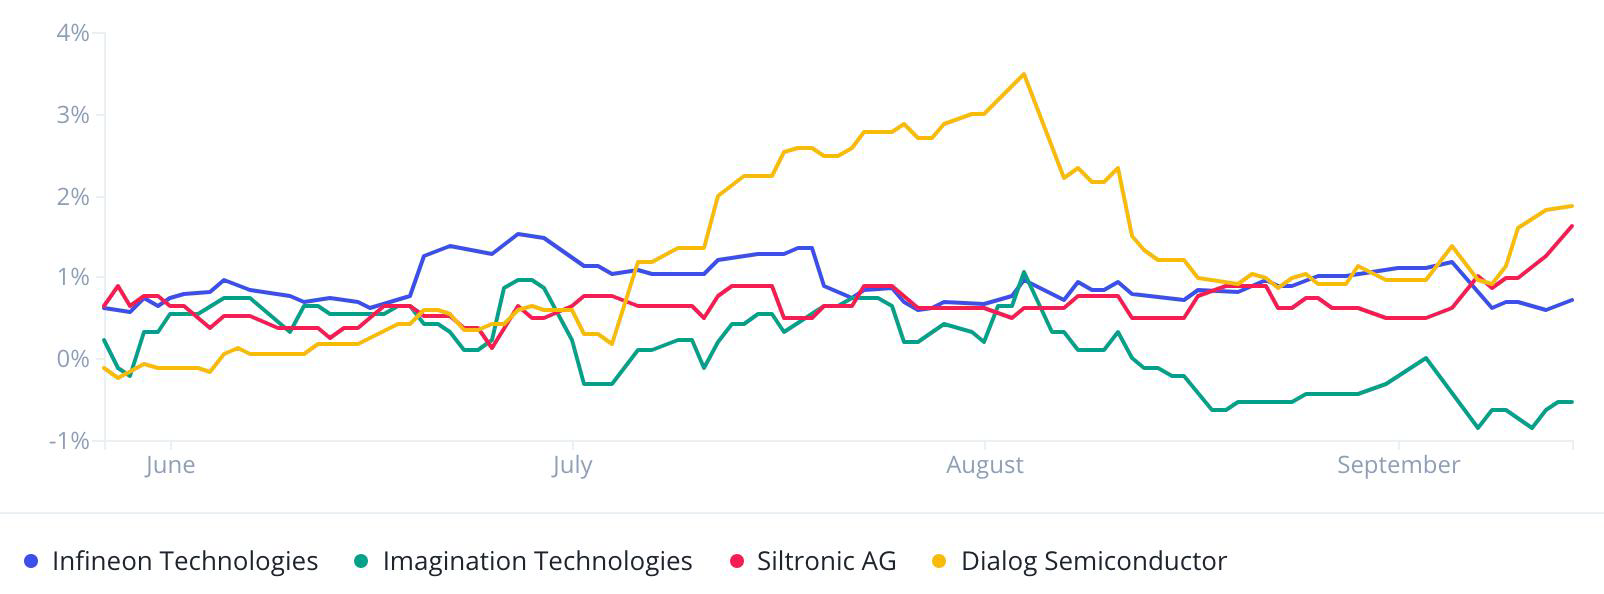
Semiconductor Industry: Analyze Headcount
To proxy for employee headcount, use the aggregated number of LinkedIn profiles that list a company as their employer. Compare competitors’ headcount or track corporate expansion and layoffs.
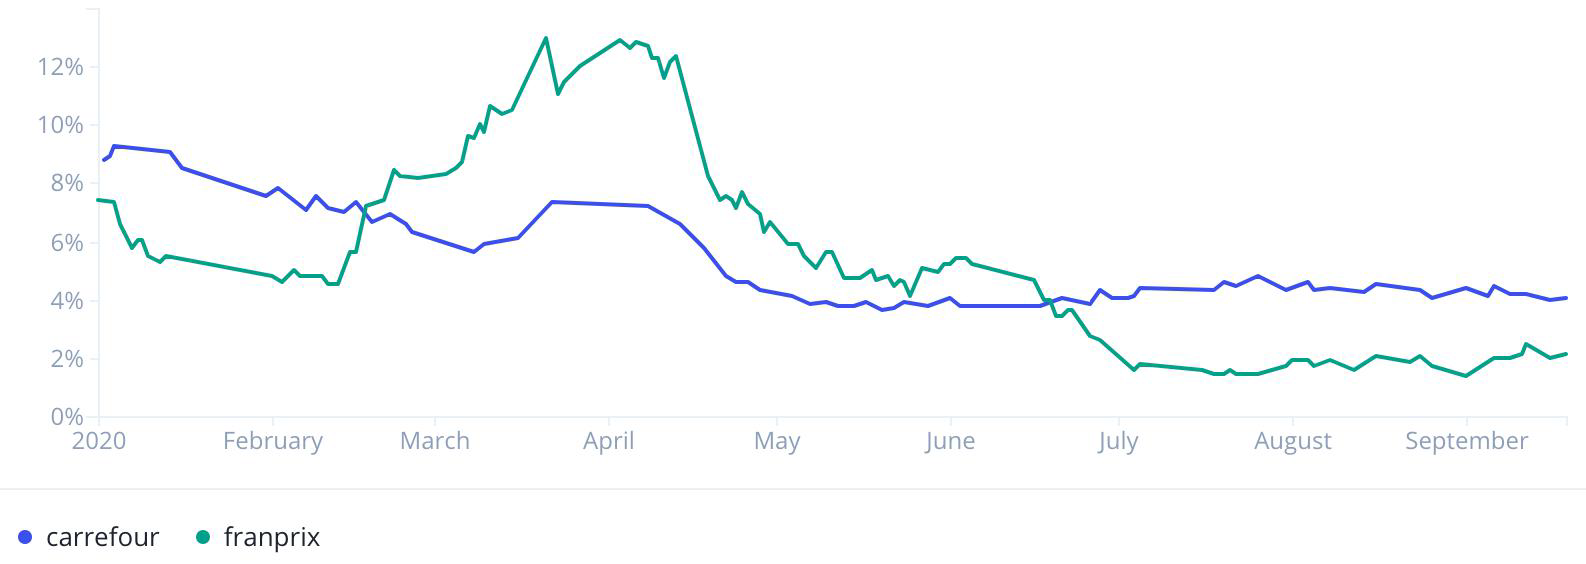
Supermarkets: Compare Foot Traffic for French Grocery Chains
Investors leverage anonymized foot traffic data, gathered from Facebook Places, to glean insights from foot traffic over time. This can be used to measure which businesses are hit hardest by the COVID-19 pandemic in real time.
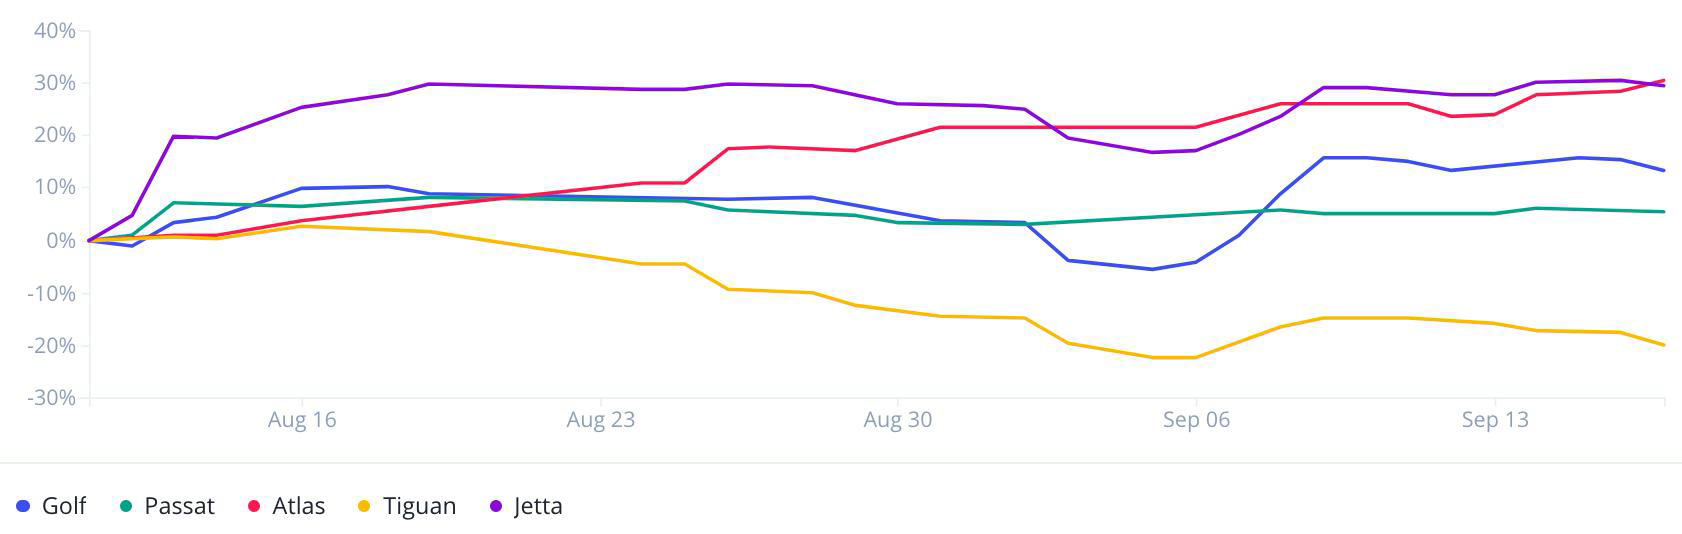
Auto Industry: Sales by VW Model
Our car inventory dataset tracks the daily inventories of all major online dealerships through each vehicle’s unique VIN identification number. Users can filter by brand, year, car model, location and other attributes to predict car sales in real time.
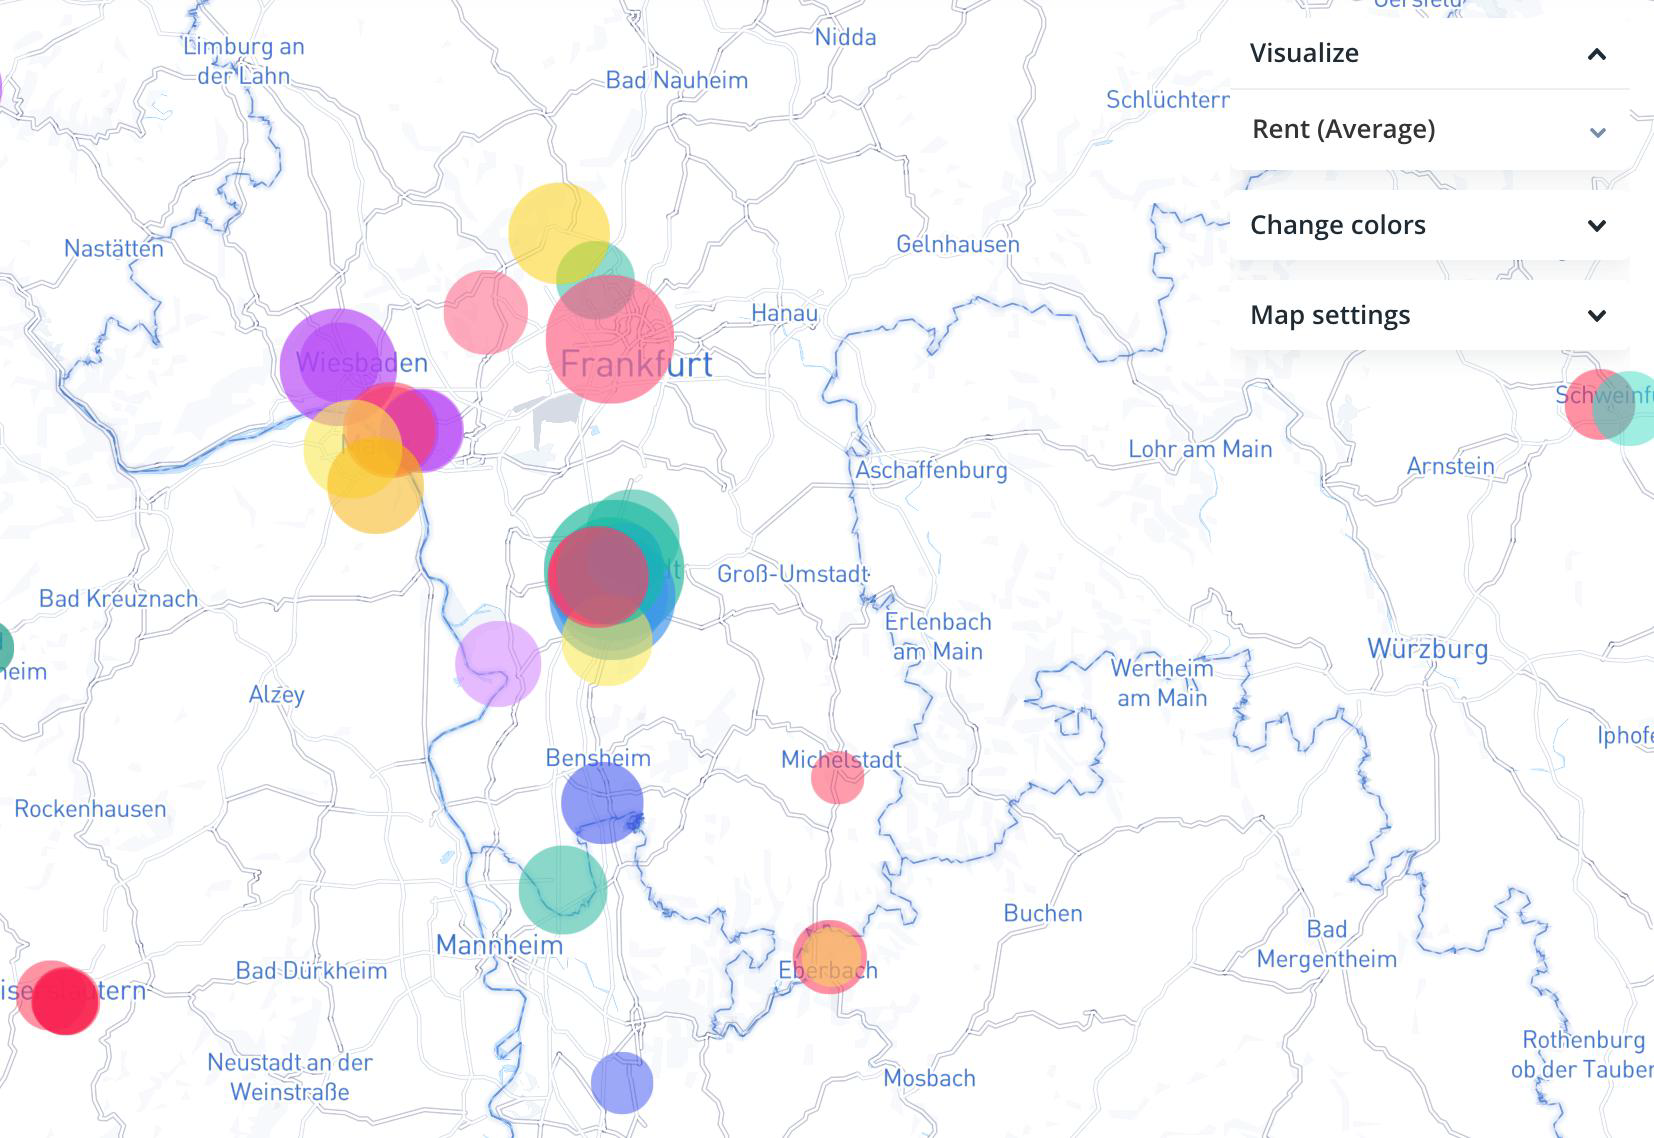
Real Estate: Map Prices Across Europe
View residential property prices across Europe in a user-friendly map. Filter by specific requirements, such as location, property size, or number of bedrooms and bathrooms, for insights on local and regional real estate markets.
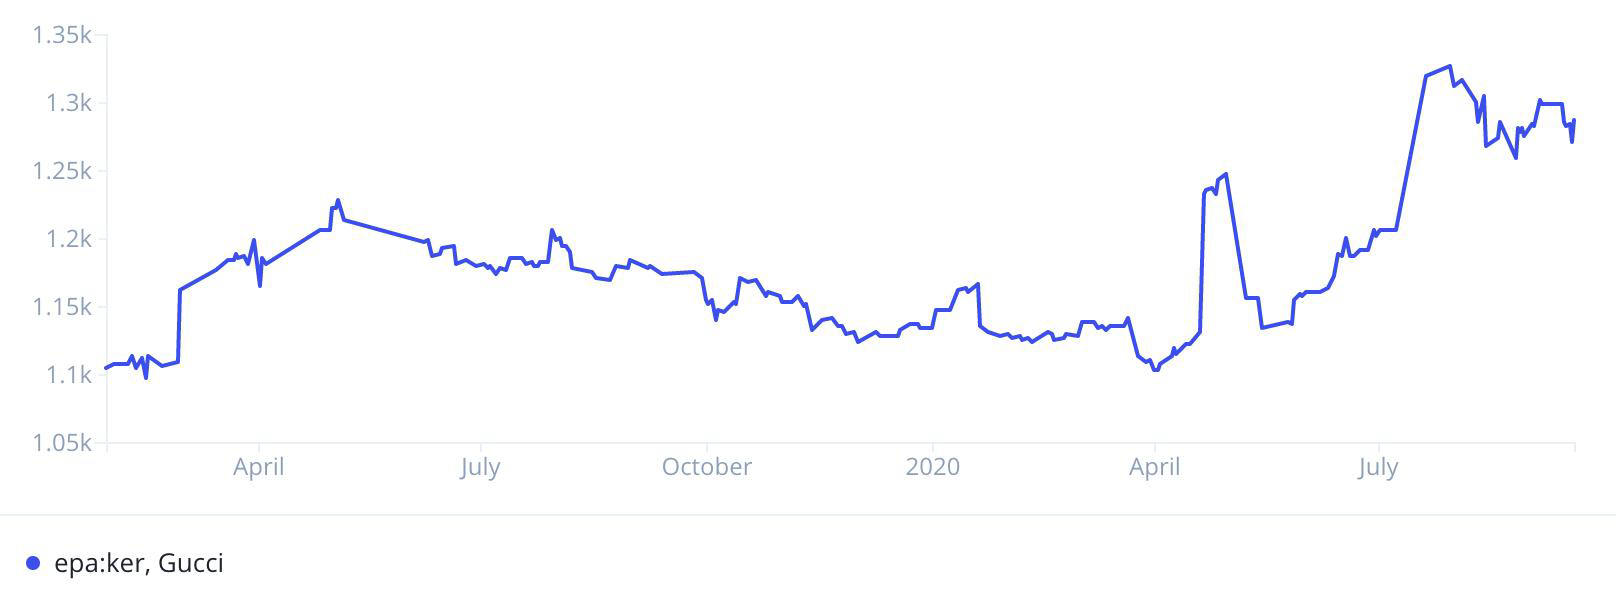
Luxury Goods: Track Gucci Pricing Trends
View and compare thousands of retailers’ pricing trends. Track changes in the number of discounted items, as well as the percentage discount daily. Use retailer-listed products and discount prices to derive trends in companies’ pricing strategies.
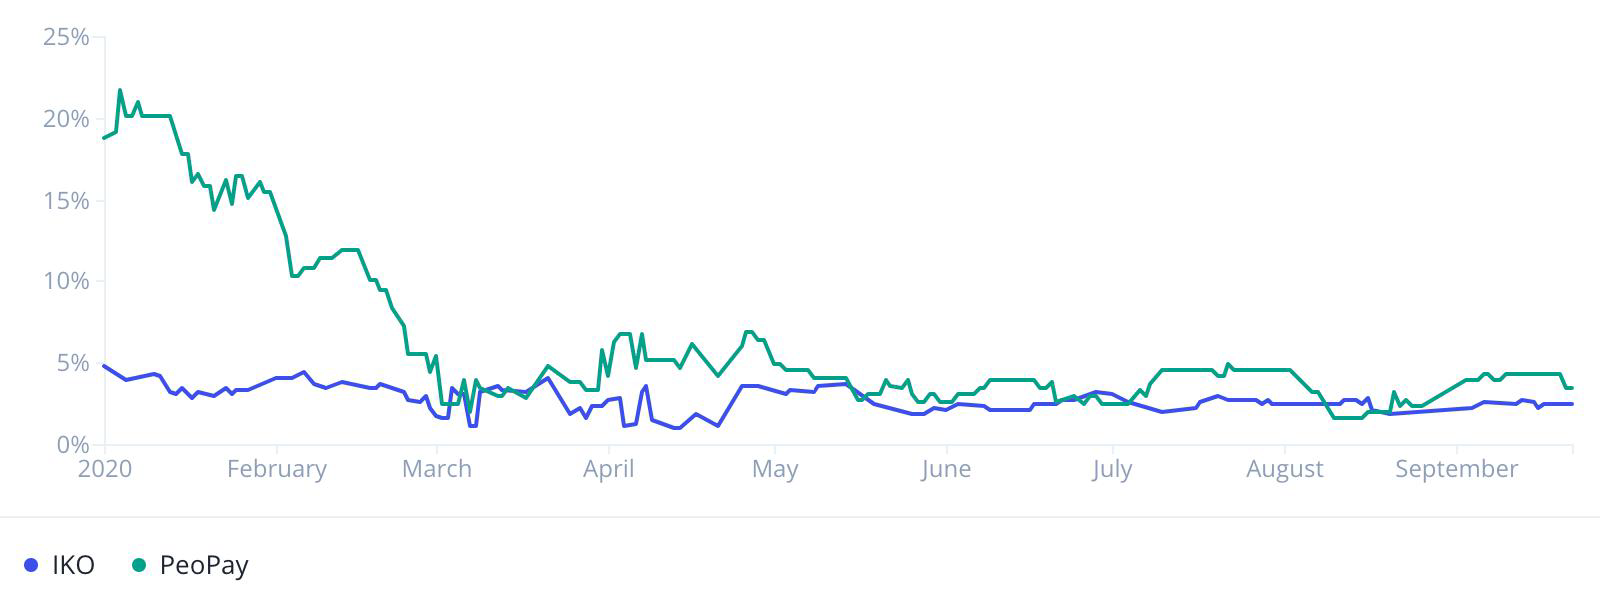
Banking: Track App Ratings for Major Polish Banks
As businesses go mobile, analyze real-time user engagement data from mobile apps and social media. Rank competitors on their number of app reviews and ratings.
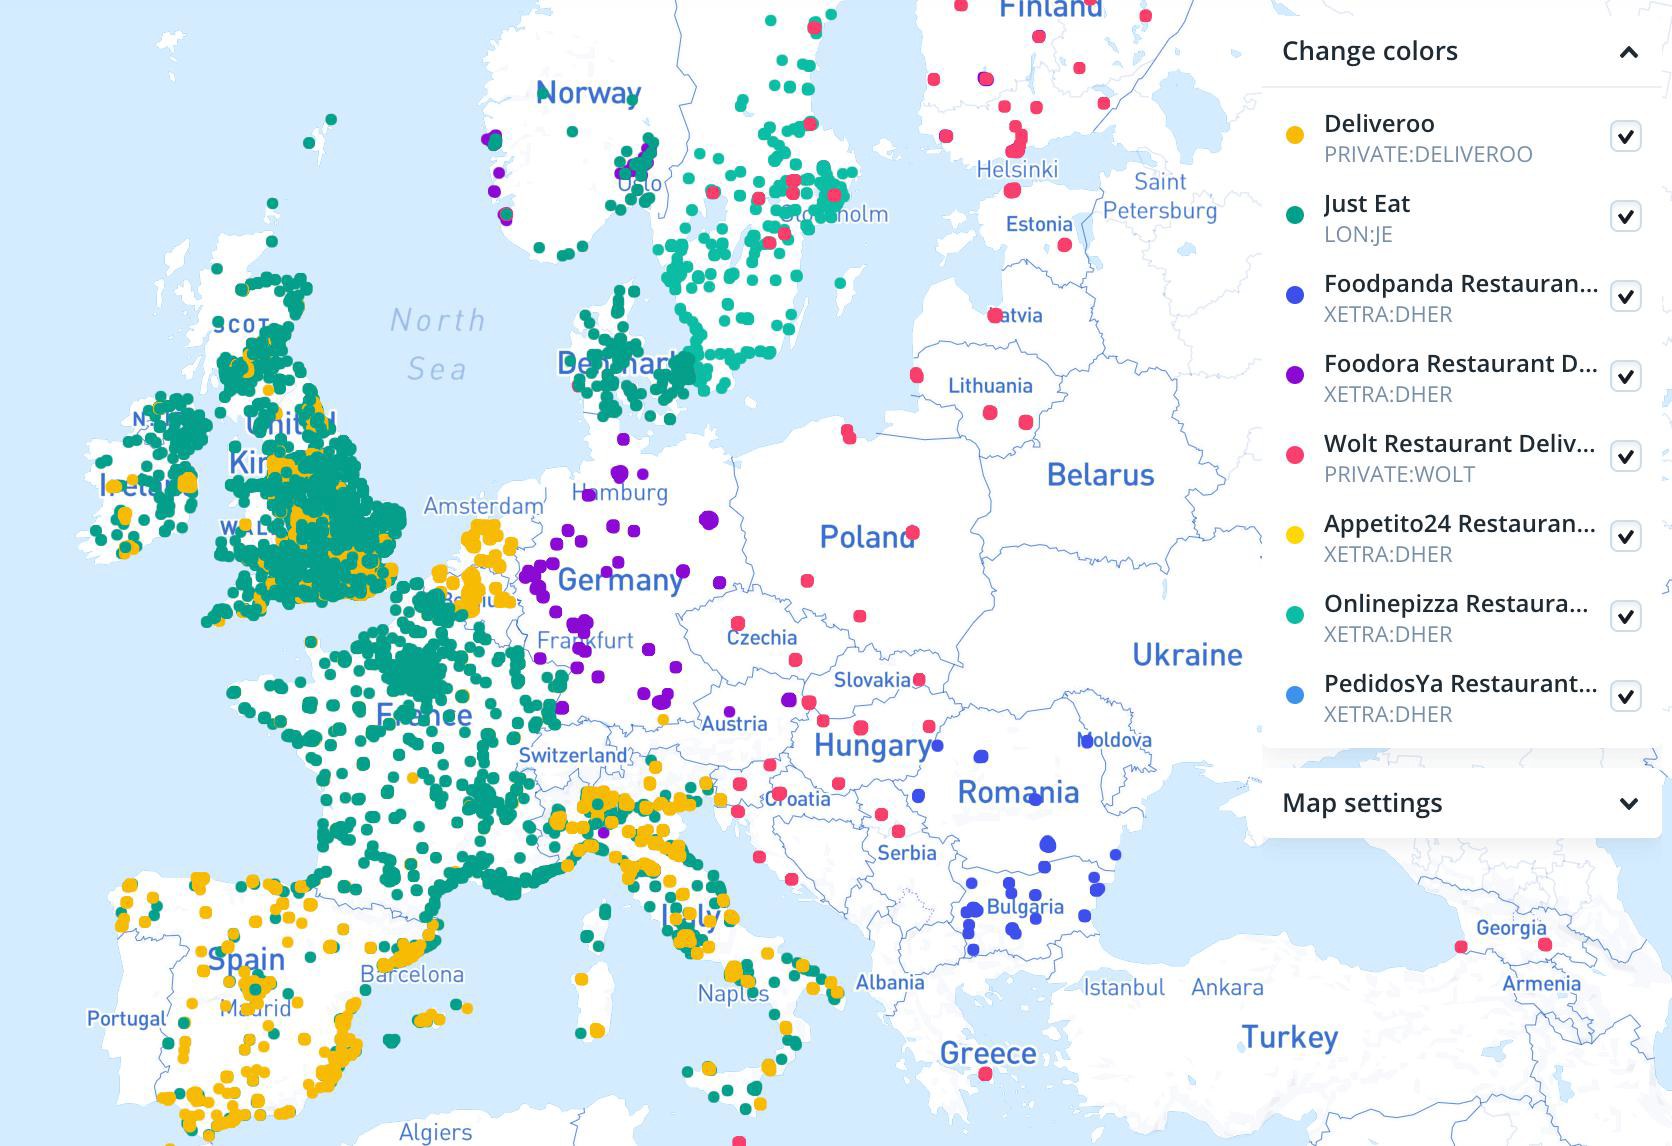
F&B: Food Delivery Wars Across Europe
As the food delivery wars heat up across Europe, map the restaurants that partner with each player to understand where competitors are fighting for market dominance. Display thousands of restaurant locations across Europe in a user-friendly map.
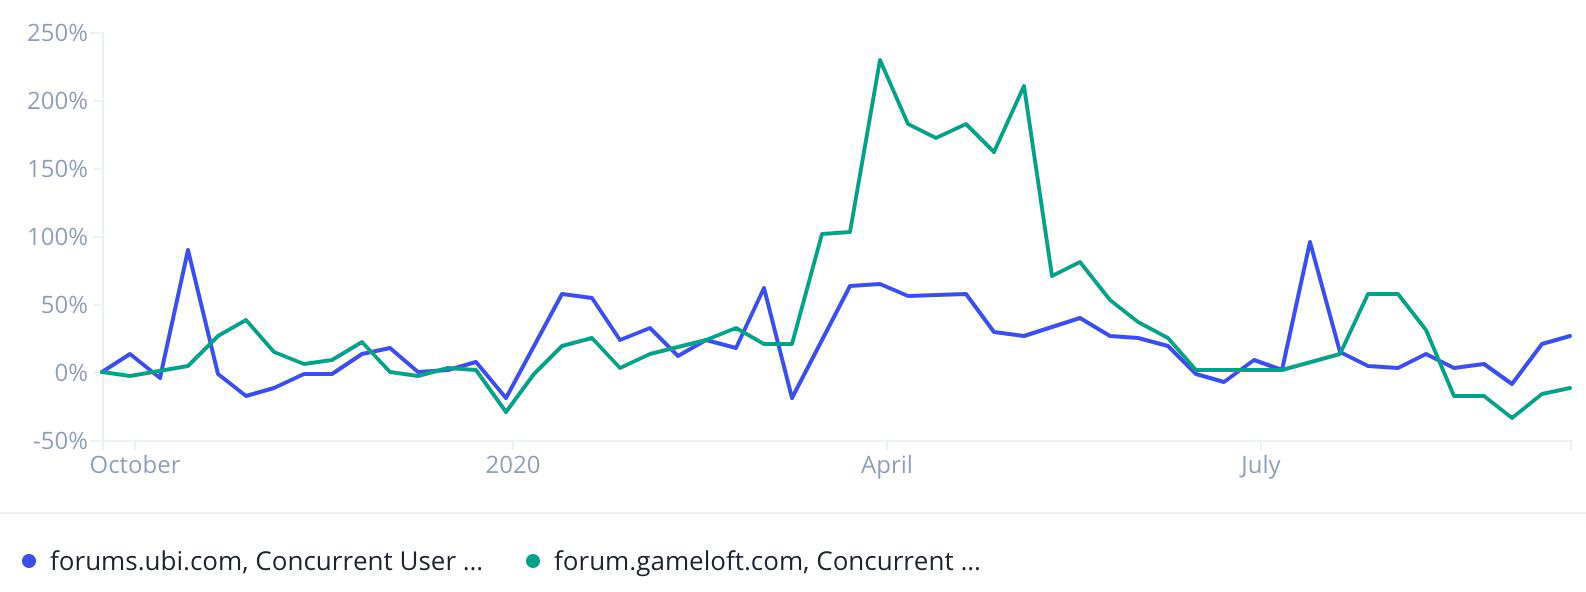
Video Games: Track Number of Users for Ubisoft and Gameloft
Thinknum’s Traction dataset is comprised of publicly available metrics harnessed from corporate websites. It tracks user activity for Ubisoft and Gameloft by indexing the number of concurrent users, giving investors a real-time view of who’s winning in the video game industry.
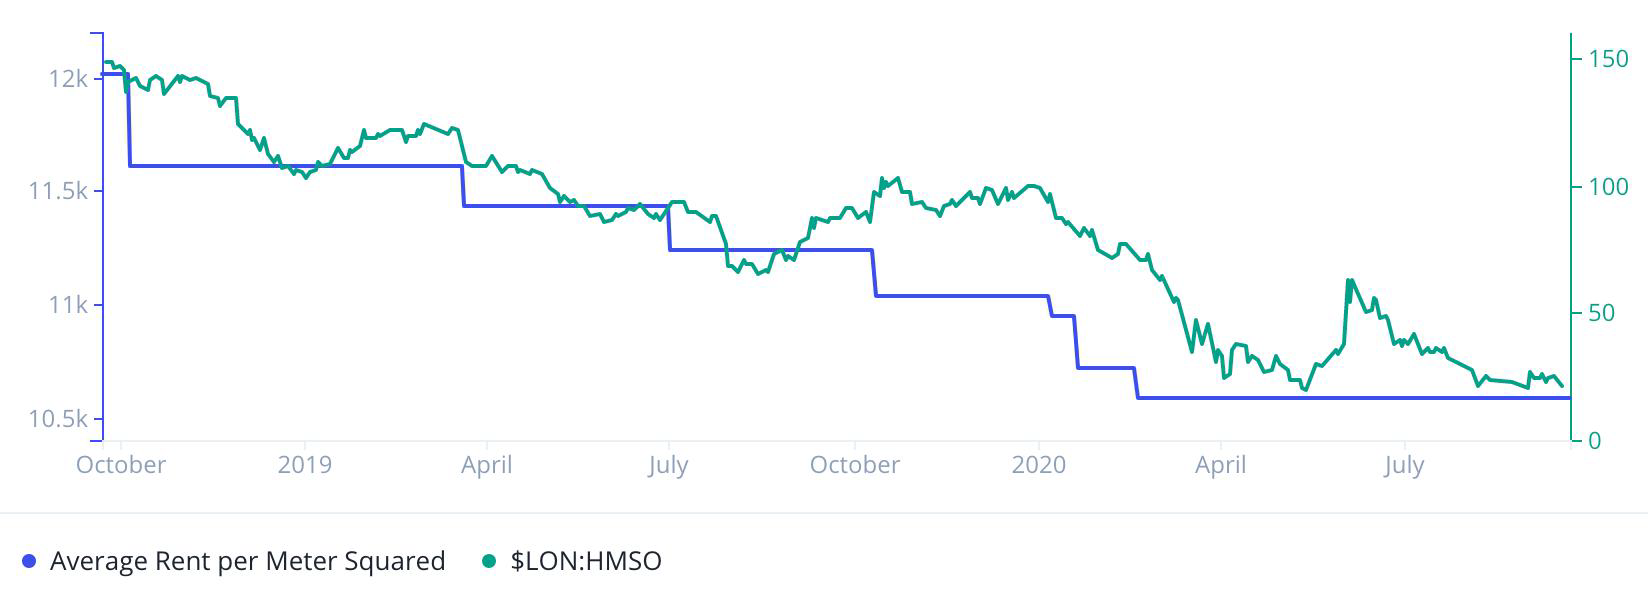
REITs: Track Hammerson’s Average Event per Square Meter
Track the tenant directories of mall REITs on a daily basis. Identify the total number of tenants for a REIT over time, or a REIT’s exposure to specific tenants. Drill down on a given REIT to find its aggregate vacancy rates or average rent per square meter.