Your CX testing lives or dies on the quality of your data. You can’t form valid, testable hypotheses using questionable data. And you can’t trust the outcomes of your tests if you don’t know you’re looking at accurate metrics.
That’s why you need to build your testing program around a Single Source of Truth (SSOT) dataset. If you can’t, even the simplest A/B test will lack value. This article explores why establishing an SSOT is so important and shares some of the field-tested best practices we’ve developed for doing that here at Kameleoon.
Table of contents
What is a Single Source of Truth (SSOT)?
A Single Source of Truth (SSOT) is a single data source that is used as the definitive “truth”, on which all data-driven decisions are based, and around which you conduct all analytics work.
Without an SSOT, you risk your data fragmenting into silos guarded by different teams for different functions. There’s no standardization, no consensus, and no way to know whether anyone is making decisions based on the best available information.
An SSOT isn’t a particular technology or a system. It’s a business practice designed to get optimal results from your team’s activities. Some companies have saved millions by shifting to an SSOT data strategy without even touching the underlying work.
Studies have shown that high-quality customer behavior metrics remain the most sought-after data for informing strategic decisions. For several years running, in PricewaterhouseCoopers’ annual CEO survey, CEOs rate that as the most important metric they want for strategic planning.
Do you need an SSOT for your testing?
Experimentation teams are swimming through data generated in their analytics platforms, CRM, testing platforms, and more. They need to establish an SSOT for testing to clarify what their teams want to do. Let’s consider an example.
One of Kameleoon’s clients launched a campaign to optimize its website’s search function. They conducted server-side tests that involved tracking traffic to an access page.
But they encountered a problem many experimentation programs face: the data in Google Analytics showed one number of page visits, and their experimentation tool showed another. The difference was over 9 percent.
Being an e-commerce website with over a million visitors per month, the decision of which data set to trust made a big difference in the company’s KPI reporting. While some mid and enterprise brands can ignore disparities up to 10 percent in visitor statistics, a 9 percent disparity in data made this company’s experimentation team nervous.
This team had only recently gotten buy-in for their experimentation program, including a budget to invest in tools like Kameleoon. They were hoping for tests with clear conclusions. Instead, the accuracy of their data was in doubt. They needed to establish an SSOT.
We helped this company clean up their visitor data tracking, establish an SSOT and get the testing results they needed to grow. To do that, we helped them adopt seven SSOT best practices. We share those best practices here because any CX team looking to wrangle their testing data and get the most from their experimentation program can use these to grow.
Best practices for eliminating test data discrepancies and establishing an SSOT
1. Before you do anything else, conduct an A/A test
Whereas an A/B test compares an old versus a new version of your product or page, an A/A test compares like against like. Why would you want to do this? So you can compare the data generated by each monitoring platform.
In the A/A test, both variations are the same, but users who see them will be different:

How to take action
Before you conduct any serious A/B testing or roll out a new implementation where you’ll want to gather data, run an A/A test to calibrate. In a perfect world, your A/A test will return identical results. In reality, that rarely happens, but you’ll still learn how much of a discrepancy you’re dealing with.
For example, running an A/A test allows you to see what metrics Google Analytics gets compared to your testing tool across the same sessions, users, visits, conversions, or whichever metric you want to measure.
2. Track visitors and visits the same way in all your tools
The number of visitors or visits tracked by your analytics tools will never match up precisely with users and sessions. However, you can make sure visits are counted the same way in your analytics and A/B platforms to decrease the discrepancy.
In Google Analytics, there are two ways a visit ends:
- Time-based expiration: Here, the session expires after 30 minutes of inactivity or at midnight. Whereas, for example, in Kameleoon, it’s after 30 minutes of inactivity.
- Campaign change: If the same visitor arrives via one campaign, leaves after 2 minutes, and then comes back via a different campaign 2 minutes later, Google Analytics will count two visits. Some A/B testing tools will see this as one.
How to take action
Check how visitors and visits are counted in your analytics tool and ensure it is the same for your testing tool. Or that you can change it. At Kameleoon, we recommend using your analytics platform as the single source of truth.
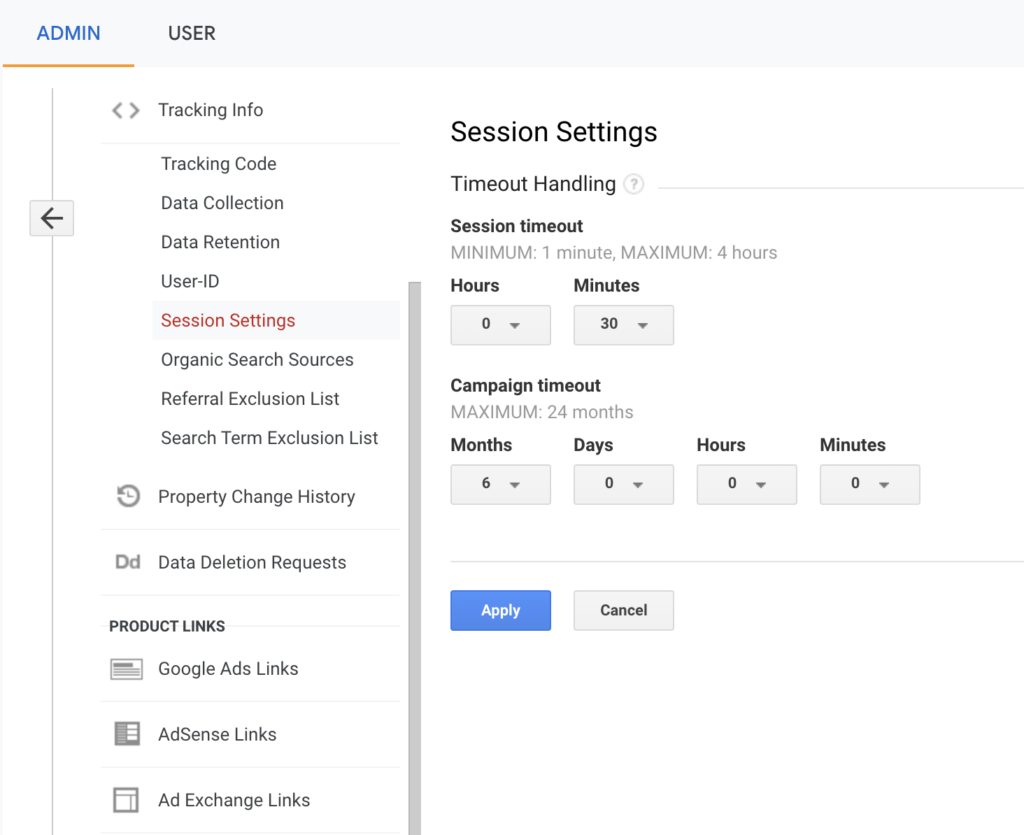
In GA, you can edit how long until sessions and campaigns are timed out under Session Settings.
Why? SSOTs should be defined at the organizational level. So even if your testing team spends their whole day working with data in your testing platform, other teams may still need to reference data from GA for other purposes. Set the SSOT to be the dataset referenced by your organization’s broadest range of teams.
3. Create browser and version filters in your analytics tool
Many A/B testing platforms do not run on Internet Explorer, so any visits in that browser are automatically excluded from experiment reports. But IE could still cause a data discrepancy if you target large, legacy organizations using it.
Another potential tracking issue is that Google Analytics is compatible with all browser versions, while A/B testing tools usually maintain full compatibility with only the last several versions.
How to take action
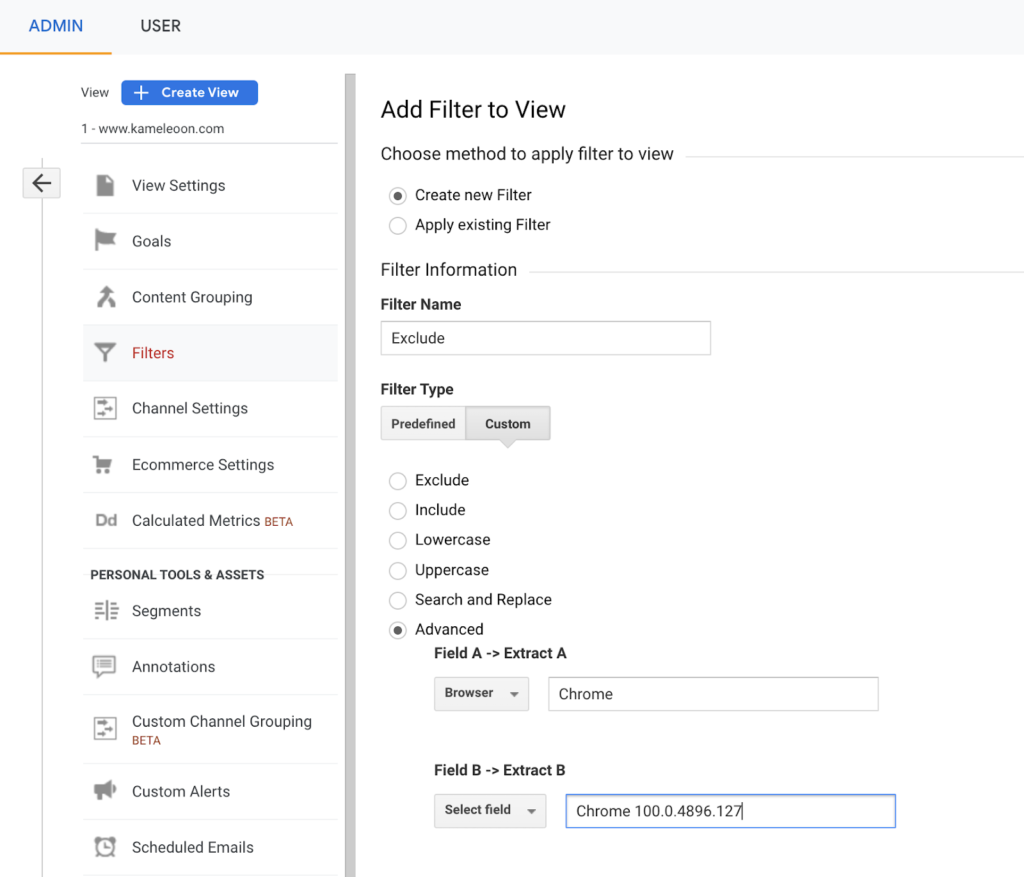
In Google Analytics, create custom filters based on the browsers and the browser versions you care about so all platforms match. You do this in
For example, under View, here’s how you would exclude an older version of Google Chrome:
4. Filter problematic traffic in all your tools
Keep your SSOT data set as clean as possible by only collecting data from legitimate audience members. You don’t want to muddy your data with bot, troll, tracker bugs, or other outlier traffic. Don’t worry about decreases in volume, the quality of your results will go up.
How to take action
Advanced A/B testing tools offer several bot filtering settings out-of-the-box. For example, they can automatically remove traffic from collected statistics if they detect outlier behavior or if the session falls into a suspicious activity condition.
On the other hand, if you’re using GA, it is up to you to decide how to detect and exclude bot traffic from your analytics data using filters. For reference, here are some conditions you might want to exclude.
- Duration of visit > 120 minutes
- Duration of visit < 100 milliseconds
- Number of events (conversions, clicks, targeting, product, page view, etc.) > 10K
You also want to exclude internal traffic from within your organization. Remember, the goal in building this SSOT dataset is to have a definitive source of data about your actual customers, not your colleagues.
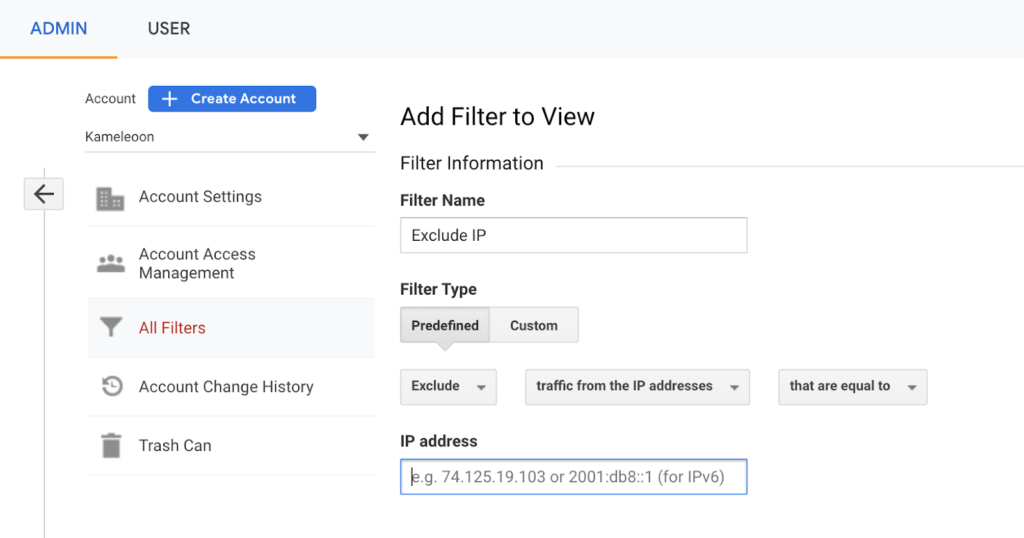
To filter out internal traffic in GA, go to Admin panel > All Filters and create a new filter. Set the filter type to ‘undefined.’ Then, add the internal IP ranges you’d like to exclude.
5. Avoid ad blockers
Many visitors use ad blockers such as Adblock, Ghostery, and uBlock. Some adblockers can also block client-side trackers, including analytics events from experimentation tools.
If a significant portion of your visitors have ad blockers enabled in their browser, there is a high chance that the number of visits recorded will vary between your A/B testing tool and your analytics platform.
How to take action
Some platforms can provide “on-premise” tracking request URLs that allow them to avoid being blocked by ad blockers. Here, tracking happens server-side, so client-side code blocking, such as from an adblocker, doesn’t stop legitimate tracking. Activate it on all possible platforms.
Another way to better understand the discrepancy between your analytics and testing platforms is to send an event to your analytics platform after your testing tool has loaded. That should give you a clear idea of the percentage of visitors using ad blockers that block your A/B testing tool. Then you will have to filter your traffic to exclude visitors using ad blockers.
6. Install your tools on all of the same pages
Snippet placement is a common root cause of data discrepancies, especially if you want to run an experiment that targets an entire site. The reason being is that many experimentation tools treat the “entire site” as all the pages carrying its code snippet. Unfortunately, that could even include your staging site if you have snippets copied there.
How to take action
If you haven’t already, now is a great time to run that A/A test to calibrate your platforms. Then, ensure all your tools are implemented on the same pages.
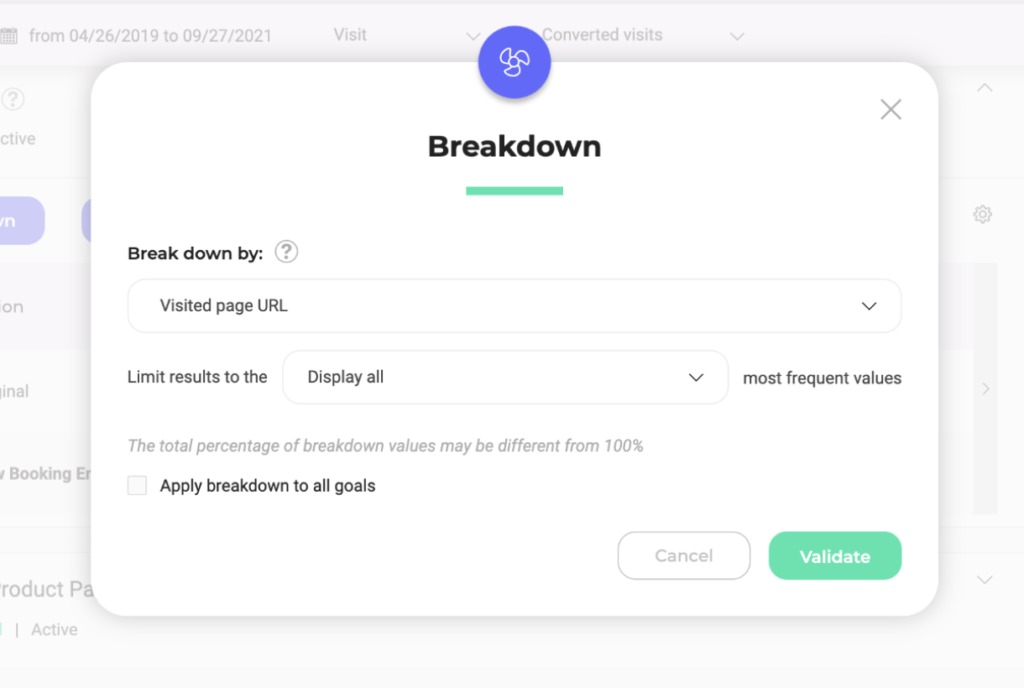
One way to identify if they’re not is to break down your data by the visited page URLs. This will show you all the main URLs where the experiment has run so that you can identify those where your testing tool should not have loaded. Here’s how this option looks like in Kameleoon:
Final Thoughts
After careful analysis, Kameleoon determined that the client with a data discrepancy encountered that last problem. Google Analytics and their testing tool weren’t running on the same pages.
Whereas GA tracked all traffic going to their search results page, they configured their testing tool with a narrower parameter—the experiment counted visits to the access page only after a search in the search bar.
While both pages looked the same, the URLs were different, creating a data discrepancy. However, once resolved, they had a reliable SSOT for testing data and were to generate many valuable insights.
By recognizing where the out-of-the-box settings in your testing tool don’t align with your analytics tracking, you can decide which number of visitors to report or how to use your settings to minimize the difference.
Eliminate discrepancies, establish a single source of truth, and rally your teams around one common data set. Establishing an SSOT is the first step to better, more reliable, and more insightful testing.
