
Competitor Analysis Templates
It would be convenient to have a single competitor analysis template for competitive analysis that could be rolled out as needed, populated and presented. All in one easy-to-use package. Unfortunately, that is not the way of things - competitor research varies too much to have an easy solution of that nature. The tables, charts and other such forms of presenting data will vary across companies, by competitor and by focus of research e.g. product comparisons, sales benchmarking and so on.
There are endless templates available online for competitive analysis, of varying quality. Many are of the basic SWOT variety, which are perhaps more suited to academic study than to actionable research in real life businesses. Some are relevant for business use and presented in attractive formats that can be adapted easily to a company's style guidelines. There is no single correct competitive analysis template - the right one will depend on the client and the project.
Below are a few examples of graphics that could be used in a competitive analysis template. Ironically, most of what we do at Aqute is not comparisons of competitors all in one table or chart or slide, but in-depth analysis of direct competitors, each of whom gets their own entire PowerPoint deck. But we do get to use some of these templates for comparing multiple companies in one place.
First, here is a basic table for SWOT analysis. We aren't big fans of SWOT analysis, but clients sometimes need it, especially when looking at a competitive landscape broadly.
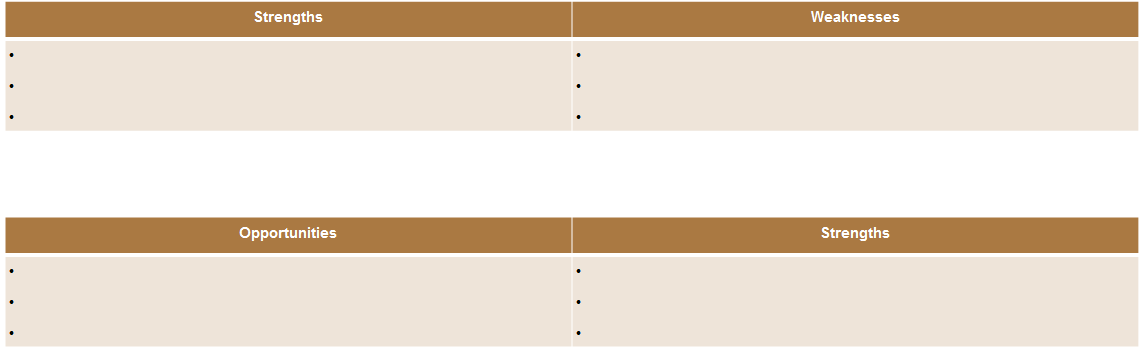
Next, same idea but comparing multiple competitors.
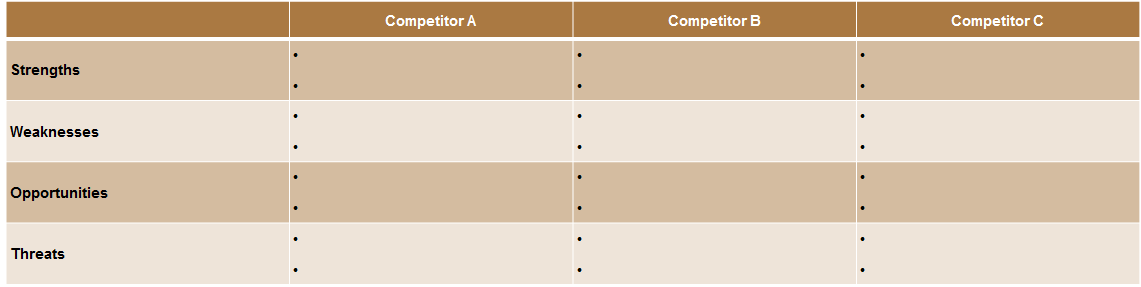
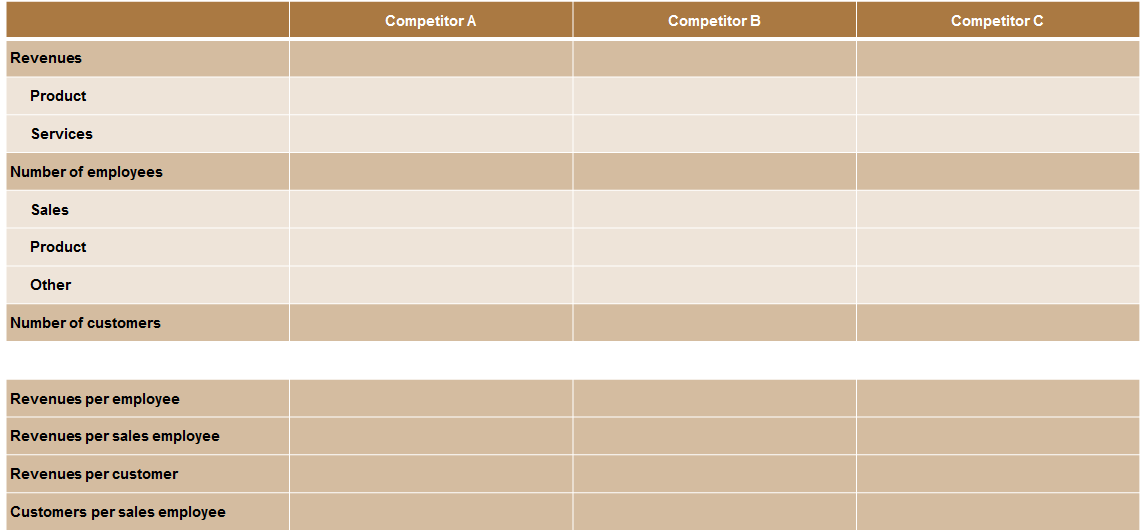
This template compares key, specific data across competitors.
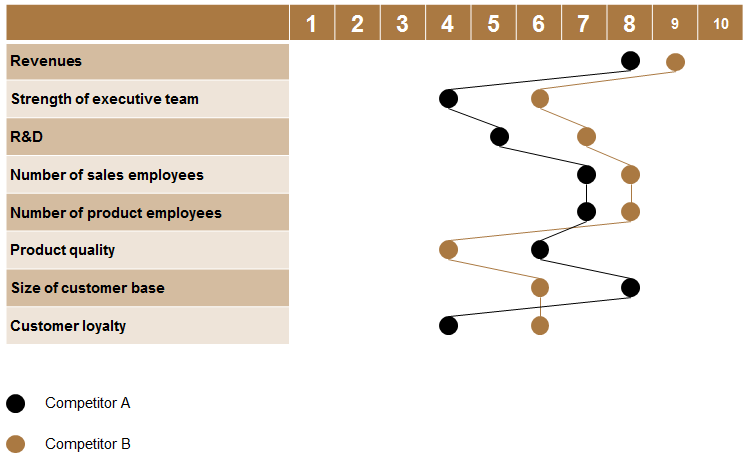
The competitor analysis template below works well when two competitors are clearly differentiated, less well when they score similarly across categories.
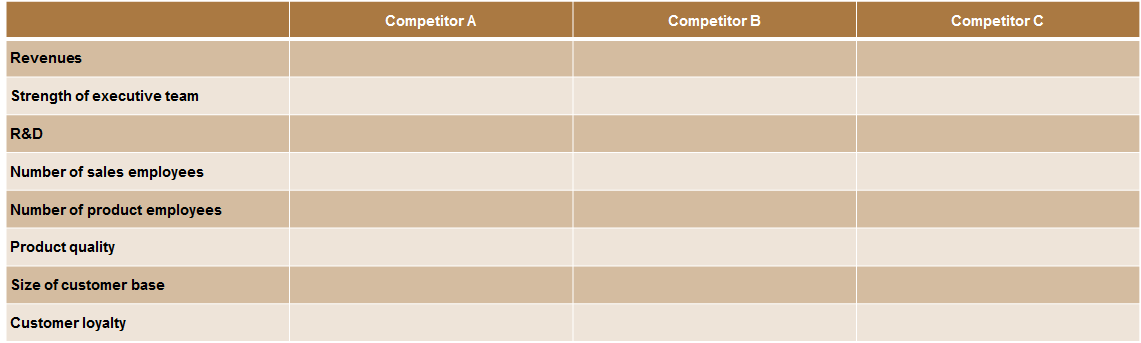
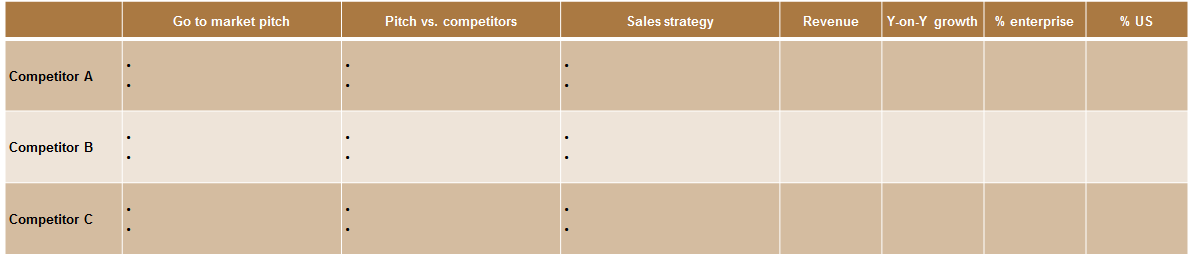
Here is a different take of a comparison table, focused on sales or revenue performance.
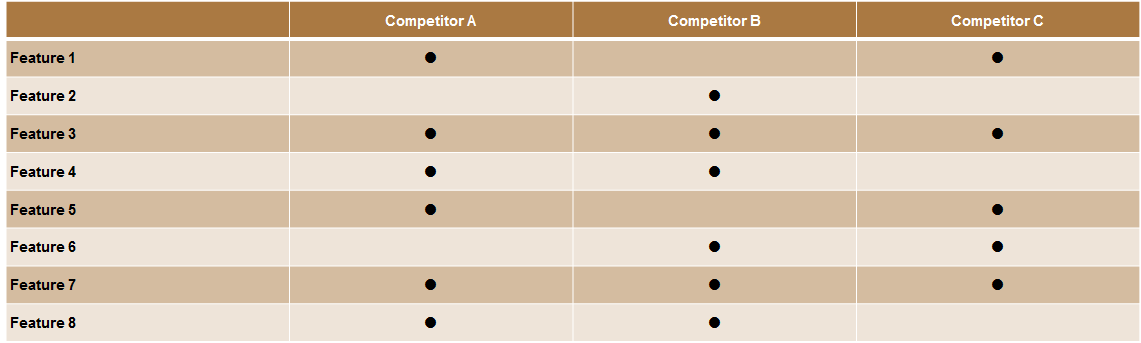
The next competitor analysis template is a simple table for product feature comparisons. More information could be conveyed with Harvey Balls. This kind of table may be of most use to a product manager - seeing features in one glance can help with making informed decisions.
Next up, one of many possible tables for summarizing multiple competitor metrics up front.
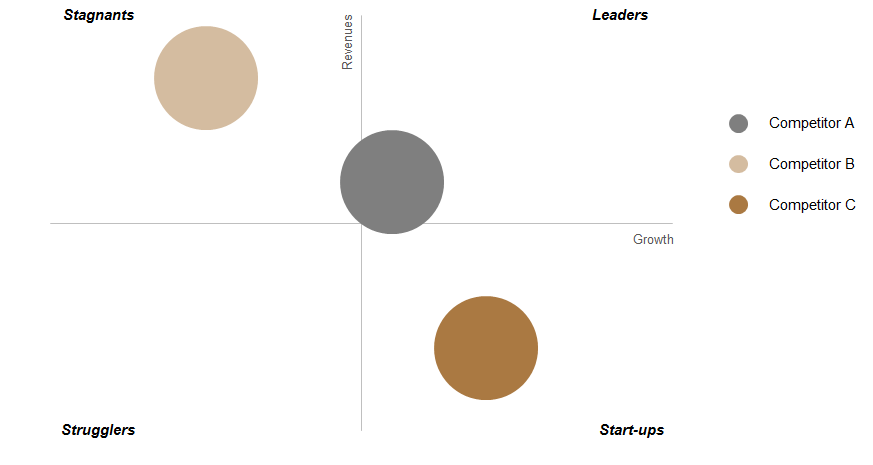
Here is one type of chart for representing visually how competitors compare against each other. Optionally, the size of the bubbles can be used to represent another data dimension.
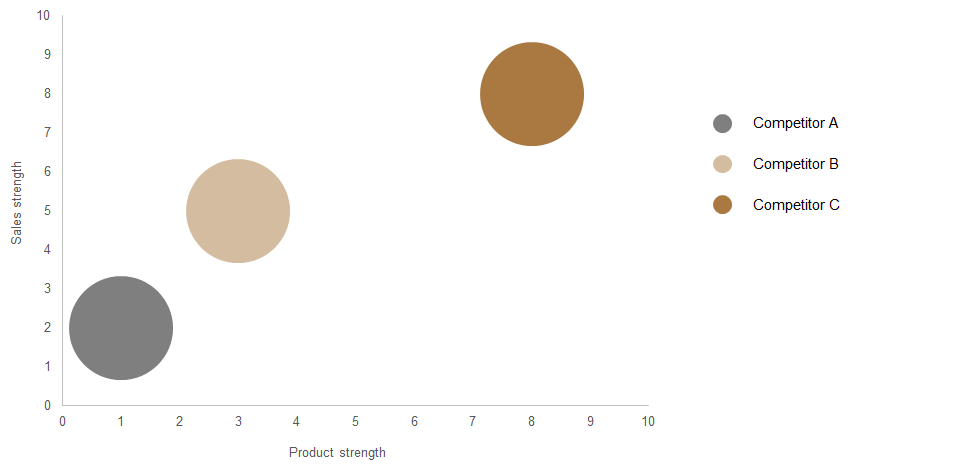
One step further turns that chart into a chart where companies can be categorized in quadrants.
Ultimately, there is nothing magical about how competitive intelligence is presented. The goal is to present actionable insights about key competitors in a way that helps clients make informed decisions about pricing strategy, marketing tactics, product features, product development and industry trends. One could go on, and the best competitor analysis tables or charts are those you do yourself for your specific requirements. Perhaps the ones here can be a starting point.
These competitor analysis templates can be downloaded here (or via our competitive intelligence tools page).


