Share this
by Thomas Krisak on April 12, 2024
Using a social listening tool to monitor international natural disaster-related conversation
Recent Storms: December 2023 to March 2024
Since December, the world has had several cases of severe weather, including the recent bout of thunderstorms and tornadoes that swept through the Midwest and Northeast of the United States at the end of February. With these actual storms came figurative torrents of posting on social networking sites: in total, between December 1st, 2023, and March 1st, 2024, unique posts that mentioned “tornado” numbered over 3 million.
With even just a simple query like this, the Infegy product suite is a powerful tool for researchers. In this case, the data was not only plentiful but also very easy to handle. Very little noise interrupted data collection, with the only notable disturbance being some mention of “workouts”, which was resultantly excluded. From the overarching simple query, relationships and correlations became obvious: users posted in response to tornadoes. Although perhaps an obvious observation, this relationship opened the door for many other discoveries. Using no resources other than Infegy Atlas, the types of posts and the location of the storms were easily determined.
During each of these climate events, posting increased for users in the affected areas, with peaks occurring not surprisingly on the days the tornados emerged. Peaks of posting, and the tornadoes that caused them, occurred on December 10th and 17th, January 9th, and February 1st, 22nd, and 28th (fig. 1).
-1.png?width=680&height=283&name=Image%201%20-%20Post%20Volume%20(5)-1.png)
Figure 1: Volume of posts that included "tornado" between Dec 1st, 2023, and March 1st, 2024. Other figures are also from data in this period unless otherwise noted.
Types of posts
At least 429,000 posts clustered around narratives (fig. 2) concerning severe weather warnings, with one linking “warning” to a location, “county,” and another discussing the “threat” of “severe” “weather.” Moreover, words seen in these narratives – such as “warning,” “severe,” and “issued” – were among the most prevalent vocabulary (fig. 3) in all posts (fig. 3). Together, these data trends indicate that the most common content regarding tornadoes is likely warnings about incoming weather.
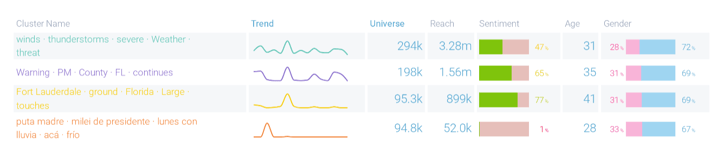
Figure 2: List of most common narratives from posts including "tornado".
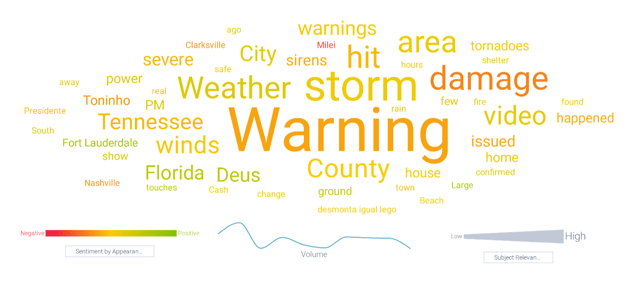
Figure 3: The most commonly seen topics from posts including "tornado".
The highest volume of these warning posts came from smaller, individual accounts that make weather-based content, although the farthest-reaching posts remained from largely known news outlets (fig. 4a-b). Upon inspection of some top-posting smaller influencers (Twitter users @brandon58153307, @cbearweather, @369hurricane), they report in much the same way as the larger influencers. Although they sometimes focus on weather local to their area, they post more about weather in general, and mostly in the US. However, it is important to note that this sample size is small, as each account must be manually inspected for its content.
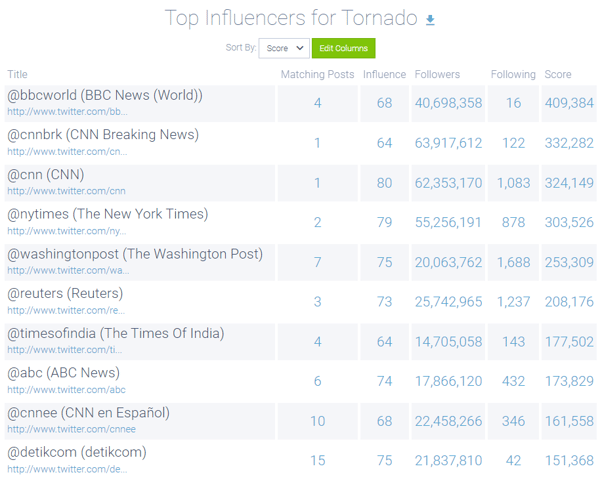
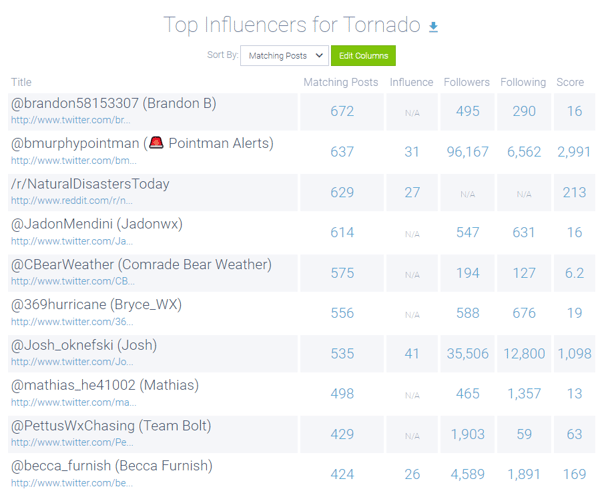
Figure 4: Influencers with the most posts including "tornado" vs. Influencers with the highest scoring posts including "tornado".
Regardless of the source, however, their overall preferred platform was Twitter/X (fig. 5), likely for convenient and quick dissemination of warnings and centrality to breaking news. Compared to other platforms, Twitter/X enables solely text-based content to spread quickly through its huge user base, easily creating conversation within and between networks of people and thus increasing the chance that those who need to be warned of an incoming tornado will see the message in time.
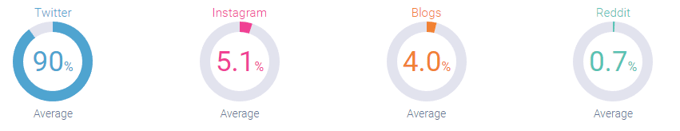
Figure 5: Platforms used for posts containing "warning" and "tornado".
Post sentiment
Overall, posting surprisingly registered with a 55% overall positive sentiment (fig. 6). Nearly all storms except for the February 22nd event changed sentiment valence to around 60% negative, as seen in the periods immediately following December 17th, January 9th, and February 28th.
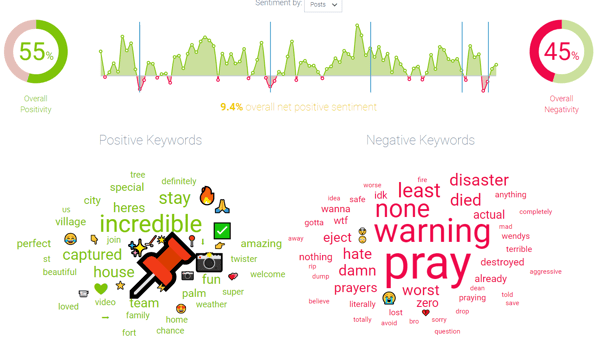
Figure 6: Sentimental keywords for posts containing "tornado". Posting peaks are denoted by blue markers.
Although overall sentiment was positive, negatively-valenced words were more uniform. Recalling the most prevalent linguistics, “warning” was not only among the most-used negative words but also the most-used topic out of all queried posts (fig. 6). An additional query looking for some of these positively-valenced words such as “incredible” revealed that they often expressed feelings of awe at the storms or relief afterward (fig. 7).
.png?width=700&height=185&name=Image%207%20-%20Narratives%20(1).png)
Figure 7: List of most common narratives from posts including "tornado" AND “incredible” OR “amazing”.
Language
Although the queried content was mostly in English (58%), other languages such as Portuguese (19%), Spanish (15%), and Indonesian (3.8%) held a share of the corpus as well (fig. 8). Whether focused on or within one country, these statistics indicate a language-diverse posting population. As further discussed later in this analysis, however, tornadoes occurred outside of the US, where English is not the national language (fig. 11-16).
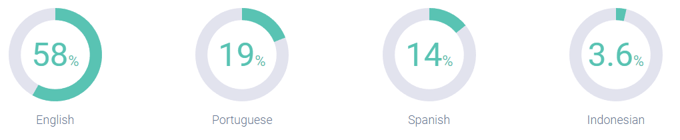
Figure 8: Language distribution of posts containing "tornado".
Posting peaks:
December 10th, 2023
The first peak over the past three months occurred on December 10th, 2023, with approximately 41,000 posts. According to the narratives found in the data between the 9th and the 11th (fig. 9), storms and tornadoes hit the Southeastern US in areas such as Tennessee and North Carolina. This narrative conclusion is partially reinforced by posters’ location information (fig. 10), with posts originating largely from Tennessee.
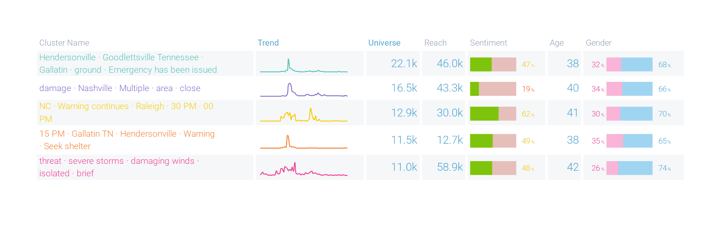
Figure 9: List of most common narratives from posts including "tornado" between Dec 9th and 11th, 2023.
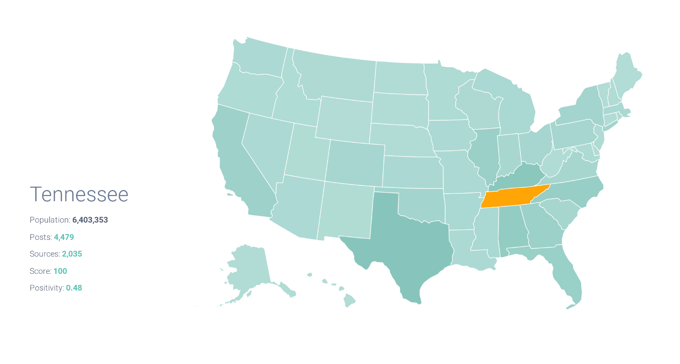
Figure 10: Density map of the US for posts containing "tornado" between Dec 9th and 11th, 2023.
December 17th
The next peak occurs not long after the first, on December 17th, gathering more than 278,000 posts in a two-day period. According to the post density world map (fig. 11), the majority of this content came from Argentina. For geographic data, however, it is once again pertinent to realize that many accounts do not share location information. Thus, cross-referencing other data categories is necessary for conclusions. In the case of the December 17th tornadoes, posts during this period were mostly in Spanish (fig. 12), further confirming that these storms hit Argentina.
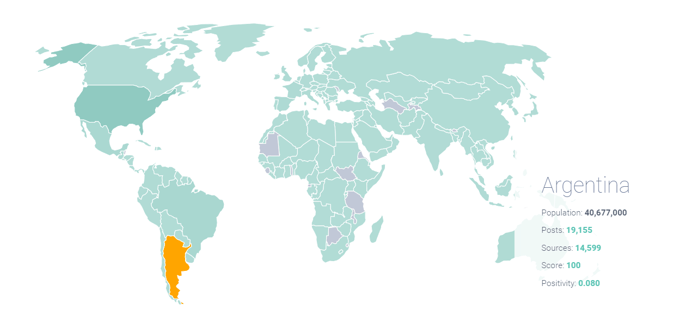
Figure 11: Density map of the world for posts containing "tornado" between Dec 16th and 18th, 2023.
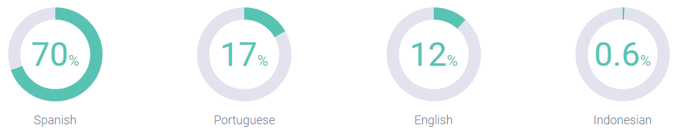
Figure 12: Language data for posts containing "tornado" originating between December 9th and 11th.
February 1st
Similarly, another non-US tornado event occurred on February 1st, 2024. For this instance, location data points to Brazil. The social networking response in the country was not as large as the neighboring Argentinian storm, numbering 4,000 (fig. 13). Around 2,500 posts also originated in the US in this timeframe, but with overall language data showing 67% in Portuguese (fig. 14), the Brazilian tornadoes were apparently more central to posting accounts.
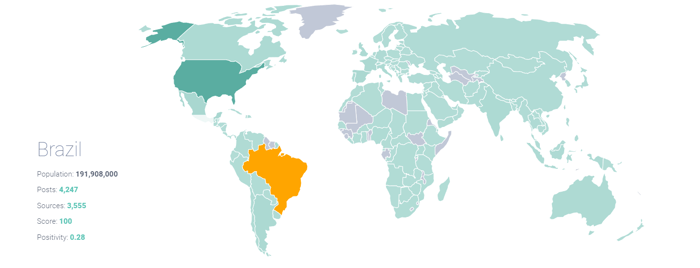
Figure 13: Density map of the world for posts containing "tornado" originating between February 1st and 3rd, 2024.
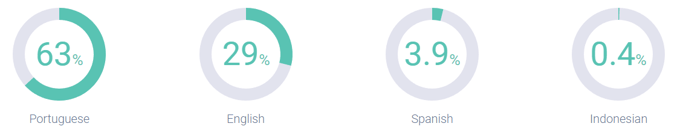
Figure 14: Language data for posts containing "tornado" originating between February 1st and 3rd.
February 22nd
Additionally, a tornado on February 22nd caused a stir in Indonesia. Once again, this is confirmed by both geographic and language data (figs. 15, 16).
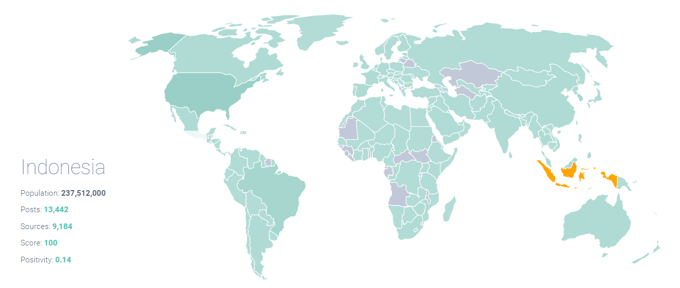
Figure 15: Density map of the world for posts containing "tornado" originating between February 21st and 23rd.
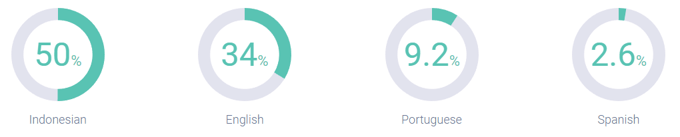
Figure 16: Language data for posts containing "tornado" originating between February 21st and 23rd.
February 28th
Finally, the most recent peak on February 28th occurred once again in the USA. Specifically, both narrative topics and location data indicate that Indiana and Ohio received the brunt of the warnings for tornadoes and storms (fig. 17).
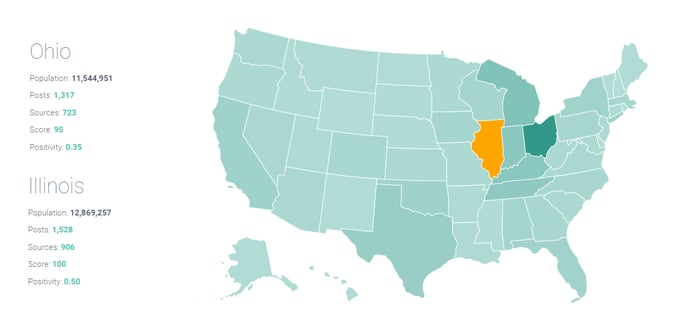
Figure 17: Density map of the world for posts containing "tornado" originating between February 27th and 29th.
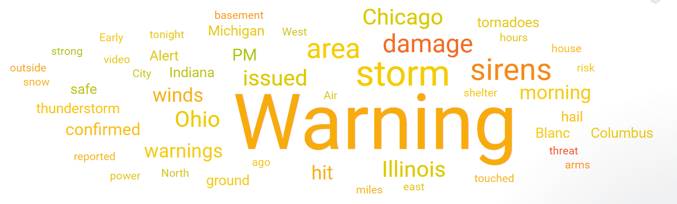
Figure 18: The most commonly seen topics from posts, including "tornado" between February 27th and 29th.
Past 15 years
Zooming out, it becomes evident that despite multiple tornado events in the past three months, this recent timeframe has not seen as much posting as previous peaks. While monthly posts peaked around 700,000 in these few previous months, as recently as March 2023 saw nearly 1.5 million. Even further back, the horrible tornado outbreak of May 2011 saw nearly 8 million posts at its peak. Moreover, peaks become less apparent approaching the present, with a 38% decrease in overall posting about tornadoes over the past fifteen years (fig. 19). Whether this was due to less frequent storms or just a decreased interest in tornadoes overall is not clear from social listening data alone.
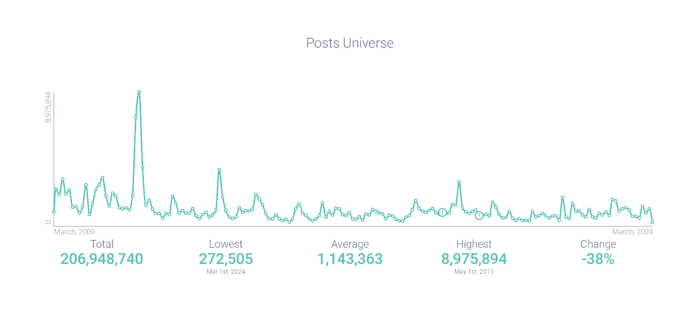
Figure 19: Volume of posts that included "tornado" over the past 15 years.
Sentimental positivity over this larger sample also plummeted, averaging 58% negativity. “Warning” along with “pray” and “destroyed” still appear commonly among negative keywords, but many different negatively-valenced words are seen only in this larger sample (fig. 20). Despite different negative language, overall language appears similar: the most common vocabulary was related to warnings about incoming severe weather and tornadoes.
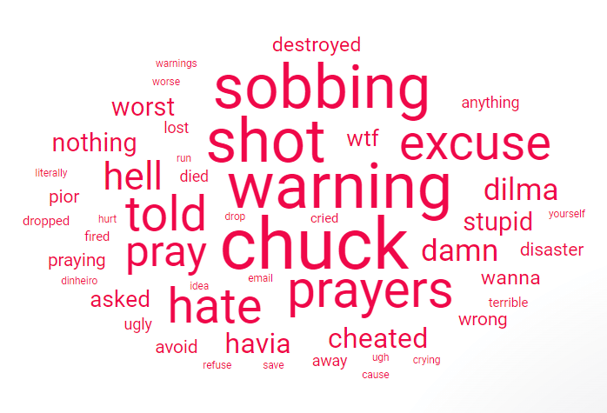
Figure 20: Negatively-valenced sentimental keywords for posts containing “tornado” over the past 15 years.
The majority of posts came from the US during this long timeframe, with some 170,000 location-detected posts coming from the country (fig. 21). This could indicate that the US experiences the highest frequency of global tornadoes, a conclusion supported by the common knowledge of “Tornado Alley.” However, alternate explanations also explain this phenomenon. More users in the States may have allowed for location to be identified by Atlas compared to other tornado-prone areas. On the other hand, tornadoes in the US – such as the May 2011 disaster – may be more severe, prompting more users to post despite not having overall more tornadoes.
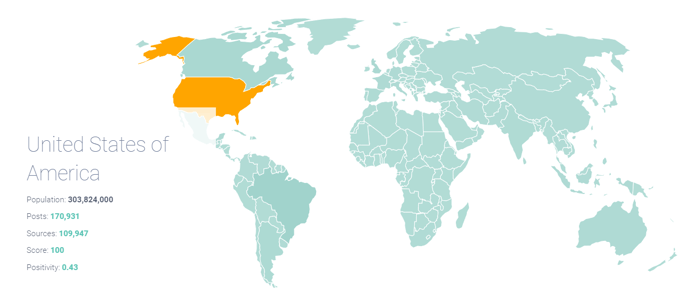
Figure 21: Density map of the world for posts containing "tornado" over the past 15 years.
Posts not from the US (and not in English) followed largely the same trend as all posts over the fifteen-year period (fig. 22). Peaks occurred in many of the same months, especially evident in May 2011. This observation has two likely explanations. Firstly, posting about tornadoes on Twitter/X, even outside of the US, is still US-centric. In other words, tornadoes are so prevalent in the United States that accounts not located here also discuss the storms. Secondly, and perhaps more likely, many accounts do not allow for identifying location information, so some percentage of these posts may still come from the US. Additionally, as citizens of the US speak many different languages, solely excluding English posts does not fully nullify this hypothesis.
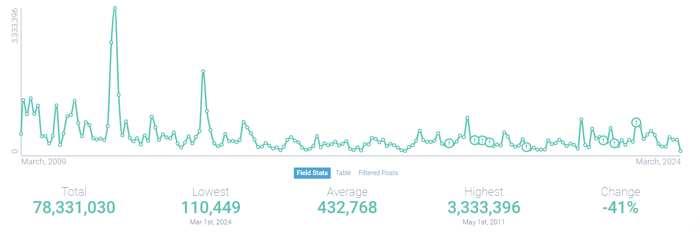
Figure 22: Non-English, non-US posts containing "tornado" over the past 15 years.
Conclusion
From the past fifteen years of data, it can be inferred that worse storms result in more posts. Although there have been multiple storms severe enough to bring about tornado warnings, overall post volume has decreased in the past months compared to the past fifteen years – a decrease that may indicate that these recent storms have not been as severe. Nonetheless, a lesser volume does not change the type of social media responses to tornadoes. Over both periods, many severe weather warnings are released on social media, especially Twitter, making it a reliable platform for not only safety information but historical weather data as well. Furthermore, reactions to the same tornadoes in different countries occur at the same time, possibly indicating that these storms often gain international attention regardless of location or time. Future research may focus on the relationship between storm strength and/or devastation and social media attention, although this is beyond the scope of social listening data itself.
This research utilized very simple queries to gather its data, highlighting how narratives and ideas can be compiled from easily obtained data using the Infegy product suite. As seen in this article, a researcher can start with a base, overarching idea to eventually gain deep insights into ideas such as sentiment, user location, and post types. For the academic researcher, this iterative process can yield novel data to guide and expand on communication research. Meanwhile, for the marketing researcher, this same process can help indicate the efficacy and timing of campaigns with very little querying effort.
We are proud to partner with the Ohio State University for this blog. If you are interested in sharing your research via our blog, please fill out the form below.