Your Data Won’t Speak Unless You Ask It The Right Data Analysis Questions

In our increasingly competitive digital age, setting the right data analysis and critical thinking questions is essential to the ongoing growth and evolution of your business. It is not only important to gather your business’s existing information but you should also consider how to prepare your data to extract the most valuable insights possible.
That said, with endless rafts of data to sift through, arranging your insights for success isn’t always a simple process. Organizations may spend millions of dollars on collecting and analyzing information with various data analysis tools, but many fall flat when it comes to actually using that data in actionable, profitable ways.
Here we’re going to explore how asking the right data analysis and interpretation questions will give your analytical efforts a clear-cut direction. We’re also going to explore the everyday data questions you should ask yourself to connect with the insights that will drive your business forward with full force.
Let’s get started.
Data Is Only As Good As The Questions You Ask
The truth is that no matter how advanced your IT infrastructure is, your data will not provide you with a ready-made solution unless you ask it specific questions regarding data analysis.
To help transform data into business decisions, you should start preparing the pain points you want to gain insights into before you even start data gathering. Based on your company’s strategy, goals, budget, and target customers you should prepare a set of questions that will smoothly walk you through the online data analysis and enable you to arrive at relevant insights.
For example, you need to develop a sales strategy and increase revenue. By asking the right questions, and utilizing sales analytics software that will enable you to mine, manipulate and manage voluminous sets of data, generating insights will become much easier. An average business user and cross-departmental communication will increase its effectiveness, decreasing the time to make actionable decisions and, consequently, providing a cost-effective solution.
Before starting any business venture, you need to take the most crucial step: prepare your data for any type of serious analysis. By doing so, people in your organization will become empowered with clear systems that can ultimately be converted into actionable insights. This can include a multitude of processes, like data profiling, data quality management, or data cleaning, but we will focus on tips and questions to ask when analyzing data to gain the most cost-effective solution for an effective business strategy.
“Today, big data is about business disruption. Organizations are embarking on a battle not just for success but for survival. If you want to survive, you need to act.” – Capgemini and EMC² in their study Big & Fast Data: The Rise of Insight-Driven Business.
This quote might sound a little dramatic. However, consider the following statistics pulled from research developed by Forrester Consulting and Collibra:
- 84% of correspondents report that data at the center stage of developing business strategies is critical
- 81% of correspondents realized an advantage in growing revenue
- 8% admit an advantage in improving customers' trust
- 58% of "data intelligent" organizations are more likely to exceed revenue goals
Based on this survey, it seems that business professionals believe that data is the ultimate cure for all their business ills. And that's not a surprise considering the results of the survey and the potential that data itself brings to companies that decide to utilize it properly. Here we will take a look at data analysis questions examples and explain each in detail.
Try our professional data analysis software for 14 days, completely free!
19 Data Analysis Questions To Improve Your Business Performance In The Long Run
What are data analysis questions, exactly? Let’s find out. While considering the industry you’re in, and competitors your business is trying to outperform, data questions should be clearly defined. Poor identification can result in faulty interpretation, which can directly affect business efficiency, and general results, and cause problems.
Here at datapine, we have helped solve hundreds of analytical problems for our clients by asking big data questions. All of our experience has taught us that data analysis is only as good as the questions you ask. Additionally, you want to clarify these questions regarding analytics now or as soon as possible – which will make your future business intelligence much clearer. Additionally, incorporating a decision support system software can save a lot of the company’s time – combining information from raw data, documents, personal knowledge, and business models will provide a solid foundation for solving business problems.
That’s why we’ve prepared this list of data analysis questions examples – to be sure you won’t fall into the trap of futile, “after the fact” data processing, and to help you start with the right mindset for proper data-driven decision-making while gaining actionable business insights.
1) What exactly do you want to find out?
It’s good to evaluate the well-being of your business first. Agree company-wide on what KPIs are most relevant for your business and how they already develop. Research different KPI examples and compare them to your own. Think about what way you want them to develop further. Can you influence this development? Identify where changes can be made. If nothing can be changed, there is no point in analyzing data. But if you find a development opportunity, and see that your business performance can be significantly improved, then a KPI dashboard software could be a smart investment to monitor your key performance indicators and provide a transparent overview of your company’s data.
The next step is to consider what your goal is and what decision-making it will facilitate. What outcome from the analysis you would deem a success? These introductory examples of analytical questions are necessary to guide you through the process and focus on key insights. You can start broad, by brainstorming and drafting a guideline for specific questions about the data you want to uncover. This framework can enable you to delve deeper into the more specific insights you want to achieve.
Let’s see this through an example and have fun with a little imaginative exercise.
Let’s say that you have access to an all-knowing business genie who can see into the future. This genie (who we’ll call Data Dan) embodies the idea of a perfect data analytics platform through his magic powers.
Now, with Data Dan, you only get to ask him three questions. Don’t ask us why – we didn’t invent the rules! Given that you’ll get exactly the right answer to each of them, what are you going to ask it? Let’s see….
Talking With A Data Genie

You: Data Dan! Nice to meet you, my friend. Didn’t know you were real.
Data Dan: Well, I’m not actually. Anyways – what’s your first data analysis question?
You: Well, I was hoping you could tell me how we can raise more revenue in our business.
Data Dan: (Rolls eyes). That’s a pretty lame question, but I guess I’ll answer it. How can you raise revenue? You can do partnerships with some key influencers, you can create some sales incentives, and you can try to do add-on services to your most existing clients. You can do a lot of things. Ok, that’s it. You have two questions left.
You: (Panicking) Uhhh, I mean – you didn’t answer well! You just gave me a bunch of hypotheticals!
Data Dan: I exactly answered your question. Maybe you should ask for better ones.
You: (Sweating) My boss is going to be so mad at me if I waste my questions with a magic business genie. Only two left, only two left… OK, I know! Genie – what should I ask you to make my business the most successful?
Data Dan: OK, you’re still not good at this, but I’ll be nice since you only have one data question left. Listen up buddy – I’m only going to say this once.
The Key To Asking Good Analytical Questions
Data Dan: First of all, you want your questions to be extremely specific. The more specific it is, the more valuable (and actionable) the answer is going to be. So, instead of asking, “How can I raise revenue?”, you should ask: “What are the channels we should focus more on in order to raise revenue while not raising costs very much, leading to bigger profit margins?”. Or even better: “Which marketing campaign that I did this quarter got the best ROI, and how can I replicate its success?”
These key questions to ask when analyzing data can define your next strategy in developing your organization. We have used a marketing example, but every department and industry can benefit from proper data preparation. By using a multivariate analysis, different aspects can be covered and specific inquiries defined.
2) What standard KPIs will you use that can help?
OK, let’s move on from the whole genie thing. Sorry, Data Dan! It’s crucial to know what data analysis questions you want to ask from the get-go. They form the bedrock for the rest of this process.
Think about it like this: your goal with business intelligence is to see reality clearly so that you can make profitable decisions to help your company thrive. The questions to ask when analyzing data will be the framework, the lens, that allows you to focus on specific aspects of your business reality.
Once you have your data analytics questions, you need to have some standard KPIs that you can use to measure them. For example, let’s say you want to see which of your PPC campaigns last quarter did the best. As Data Dan reminded us, “did the best” is too vague to be useful. Did the best according to what? Driving revenue? Driving profit? Giving the most ROI? Giving the cheapest email subscribers?
All of these KPI examples can be valid choices. You just need to pick the right ones first and have them in agreement company-wide (or at least within your department).
Let’s see this through a straightforward example.
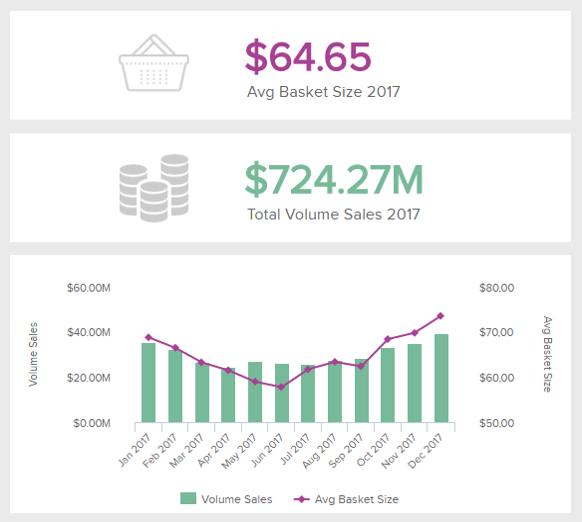
You are a retail company and want to know what you sell, where, and when – remember the specific questions for analyzing data? In the example above, it is clear that the amount of sales performed over a set period tells you when the demand is higher or lower – you got your specific KPI answer. Then you can dig deeper into the insights and establish additional sales opportunities, and identify underperforming areas that affect the overall sales of products.
It is important to note that the number of KPIs you choose should be limited as monitoring too many can make your analysis confusing and less efficient. As the old analytics saying goes, just because you can measure something, it doesn't mean you should. We recommended sticking to a careful selection of 3-6 KPIs per business goal, this way, you'll avoid getting distracted by meaningless data.
The criteria to pick your KPIs is they should be attainable, realistic, measurable in time, and directly linked to your business goals. It is also a good practice to set KPI targets to measure the progress of your efforts.
Now let’s proceed to one of the most important data questions to ask – the data source.
3) Where will your data come from?
Our next step is to identify data sources you need to dig into all your data, pick the fields that you’ll need, leave some space for data you might potentially need in the future, and gather all the information in one place. Be open-minded about your data sources in this step – all departments in your company, sales, finance, IT, etc., have the potential to provide insights.
Don’t worry if you feel like the abundance of data sources makes things seem complicated. Our next step is to “edit” these sources and make sure their data quality is up to par, which will get rid of some of them as useful choices.
Right now, though, we’re just creating the rough draft. You can use CRM data, data from things like Facebook and Google Analytics, or financial data from your company – let your imagination go wild (as long as the data source is relevant to the questions you’ve identified in steps 1 and It could also make sense to utilize business intelligence software, especially since datasets in recent years have expanded in so much volume that spreadsheets can no longer provide quick and intelligent solutions needed to acquire a higher quality of data.
Another key aspect of controlling where your data comes from and how to interpret it effectively boils down to connectivity. To develop a fluent data analytics environment, using data connectors is the way forward.
Digital data connectors will empower you to work with significant amounts of data from several sources with a few simple clicks. By doing so, you will grant everyone in the business access to valuable insights that will improve collaboration and enhance productivity.
3.5) Which scales apply to your different datasets?
WARNING: This is a bit of a “data nerd out” section. You can skip this part if you like or if it doesn’t make much sense to you.
You’ll want to be mindful of the level of measurement for your different variables, as this will affect the statistical techniques you will be able to apply in your analysis.
There are basically 4 types of scales:
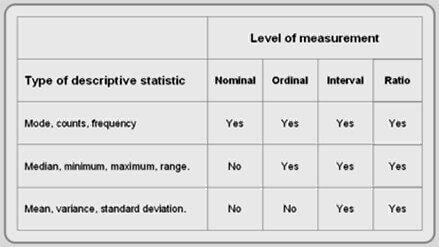
*Statistics Level Measurement Table*
- Nominal – you organize your data in non-numeric categories that cannot be ranked or compared quantitatively.
Examples:
– Different colors of shirts
– Different types of fruits
– Different genres of music
- Ordinal – GraphPad gives this useful explanation of ordinal data:
“You might ask patients to express the amount of pain they are feeling on a scale of 1 to 10. A score of 7 means more pain than a score of 5, and that is more than a score of 3. But the difference between the 7 and the 5 may not be the same as that between 5 and 3. The values simply express an order. Another example would be movie ratings, from 0 to 5 stars.”
- Interval – in this type of scale, data is grouped into categories with order and equal distance between these categories.
Direct comparison is possible. Adding and subtracting is possible, but you cannot multiply or divide the variables. Example: Temperature ratings. An interval scale is used for both Fahrenheit and Celsius.
Again, GraphPad has a ready explanation: “The difference between a temperature of 100 degrees and 90 degrees is the same difference as between 90 degrees and 80 degrees.”
- Ratio – has the features of all three earlier scales.
Like a nominal scale, it provides a category for each item, items are ordered like on an ordinal scale and the distances between items (intervals) are equal and carry the same meaning.
With ratio scales, you can add, subtract, divide, multiply… all the fun stuff you need to create averages and get some cool, useful data. Examples: height, weight, revenue numbers, leads, and client meetings.
4) Will you use market and industry benchmarks?
In the previous point, we discussed the process of defining the data sources you’ll need for your analysis as well as different methods and techniques to collect them. While all of those internal sources of information are invaluable, it can also be a useful practice to gather some industry data to use as benchmarks for your future findings and strategies.
To do so, it is necessary to collect data from external sources such as industry reports, research papers, government studies, or even focus groups and surveys performed on your targeted customer as a market research study to extract valuable information regarding the state of the industry in general but also the position each competitor occupies in the market.
In doing so, you’ll not only be able to set accurate benchmarks for what your company should be achieving but also identify areas in which competitors are not strong enough and exploit them as a competitive advantage. For example, you can perform a market research survey to analyze the perception customers have about your brand and your competitors and generate a report to analyze the findings, as seen in the image below.
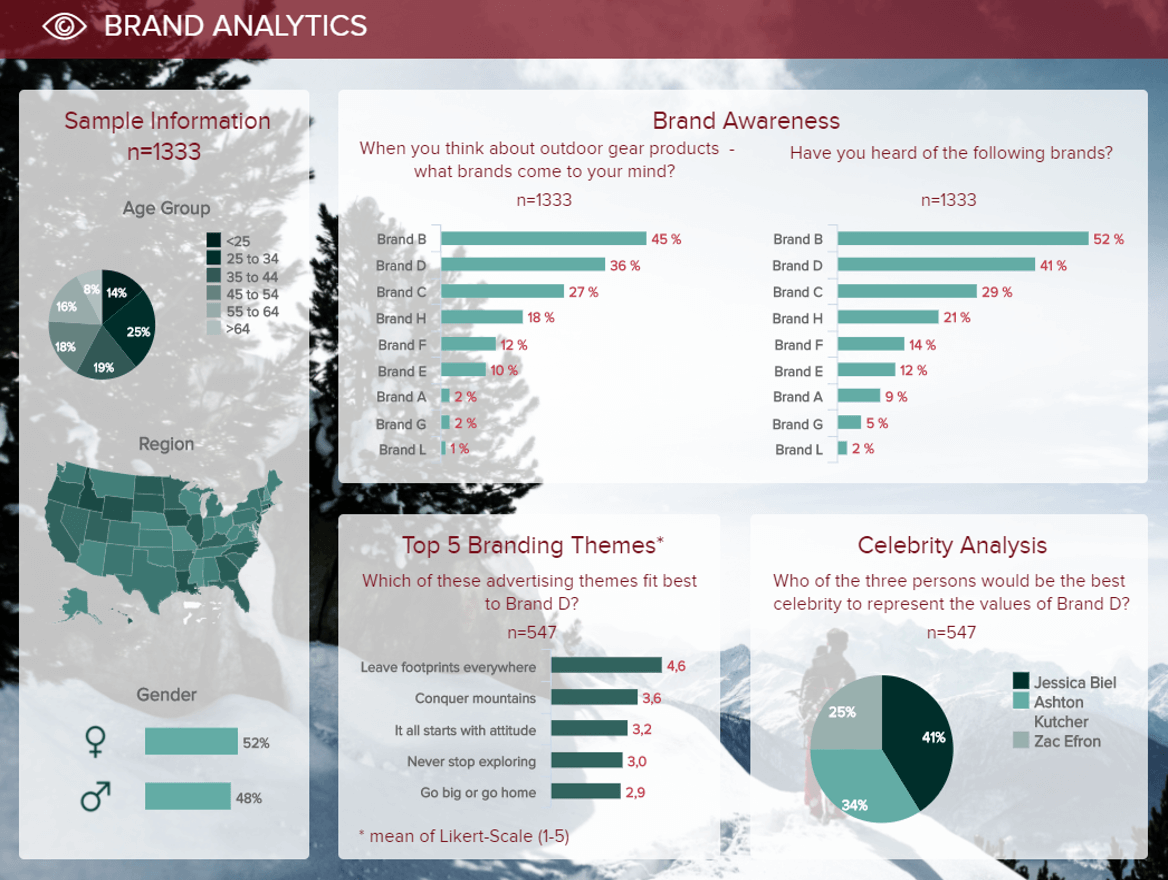
**click to enlarge**
This market research dashboard is displaying the results of a survey on brand perception for 8 outdoor brands. Respondents were asked different questions to analyze how each brand is recognized within the industry. With these answers, decision-makers are able to complement their strategies and exploit areas where there is potential.
5) Is the data in need of cleaning?
Insights and analytics based on a shaky “data foundation” will give you… well, poor insights and analytics. As mentioned earlier, information comes from various sources, and they can be good or bad. All sources within a business have a motivation for providing data, so the identification of which information to use and from which source it is coming should be one of the top questions to ask about data analytics.
Remember – your data analysis questions are designed to get a clear view of reality as it relates to your business being more profitable. If your data is incorrect, you’re going to be seeing a distorted view of reality.
That’s why your next step is to “clean” your data sets in order to discard wrong, duplicated, or outdated information. This is also an appropriate time to add more fields to your data to make it more complete and useful. That can be done by a data scientist or individually, depending on the size of the company.
An interesting survey comes from CrowdFlower, a provider or a data enrichment platform among data scientists. They have found out that most data scientists spend:
- 60% of their time organizing and cleaning data (!).
- 19% is spent on collecting datasets.
- 9% is spent mining the data to draw patterns.
- 3% is spent on training the datasets.
- 4% is spent refining the algorithms.
- 5% of the time is spent on other tasks.
57% of them consider the data cleaning process the most boring and least enjoyable task. If you are a small business owner, you probably don’t need a data scientist, but you will need to clean your data and ensure a proper standard of information.
Yes, this is annoying, but so are many things in life that are very important.
When you’ve done the legwork to ensure your data quality, you’ll have built yourself the useful asset of accurate data sets that can be transformed, joined, and measured with statistical methods. But, cleaning is not the only thing you need to do to ensure data quality, there are more things to consider which we’ll discuss in the next question.
Try our professional data analysis software for 14 days, completely free!
6) How can you ensure data quality?
Did you know that poor data quality costs the US economy up to $3.1 trillion yearly? Taking those numbers into account it is impossible to ignore the importance of this matter. Now, you might be wondering, what do I do to ensure data quality?
We already mentioned making sure data is cleaned and prepared to be analyzed is a critical part of it, but there is more. If you want to be successful on this matter, it is necessary to implement a carefully planned data quality management system that involves every relevant data user in the organization as well as data-related processes from acquisition to distribution and analysis.
Some best practices and key elements of a successful data quality management process include:
- Carefully clean data with the right tools.
- Tracking data quality metrics such as the rate of errors, data validity, and consistency, among others.
- Implement data governance initiatives to clearly define the roles and responsibilities for data access and manipulation
- Ensure security standards for data storage and privacy are being implemented
- Rely on automation tools to clean and update data to avoid the risk of manual human error
These are only a couple of the many actions you can take to ensure you are working with the correct data and processes. Ensuring data quality across the board will save your business a lot of money by avoiding costly mistakes and bad-informed strategies and decisions.
7) Which statistical analysis techniques do you want to apply?
There are dozens of statistical analysis techniques that you can use. However, in our experience, these 3 statistical techniques are most widely used for business:
- Regression Analysis – a statistical process for estimating the relationships and correlations among variables.
More specifically, regression helps understand how the typical value of the dependent variable changes when any of the independent variables is varied, while the other independent variables are held fixed.
In this way, regression analysis shows which among the independent variables are related to the dependent variable, and explores the forms of these relationships. Usually, regression analysis is based on past data, allowing you to learn from the past for better decisions about the future.
- Cohort Analysis – it enables you to easily compare how different groups, or cohorts, of customers, behave over time.
For example, you can create a cohort of customers based on the date when they made their first purchase. Subsequently, you can study the spending trends of cohorts from different periods in time to determine whether the quality of the average acquired customer is increasing or decreasing over time.
Cohort analysis tools give you quick and clear insight into customer retention trends and the perspectives of your business.
- Predictive & Prescriptive Analysis – in short, it is based on analyzing current and historical datasets to predict future possibilities, including alternative scenarios and risk assessment.
Methods like artificial neural networks (ANN) and autoregressive integrated moving average (ARIMA), time series, seasonal naïve approach, and data mining find wide application in data analytics nowadays.
- Conjoint analysis: Conjoint analytics is a form of statistical analysis that firms use in market research to understand how customers value different components or features of their products or services.
This type of analytics is incredibly valuable, as it will give you the insight required to see how your business’s products are really perceived by your audience, giving you the tools to make targeted improvements that will offer a competitive advantage.
- Cluster analysis: Cluster or 'clustering' refers to the process of grouping a set of objects or datasets. With this type of analysis, objects are placed into groups (known as a cluster) based on their values, attributes, or similarities.
This branch of analytics is often seen when working with autonomous applications or trying to identify particular trends or patterns.
We’ve already explained them and recognized them among the biggest business intelligence trends for 2022. Your choice of method should depend on the type of data you’ve collected, your team’s skills, and your resources.
8) What ETL procedures need to be developed (if any)?
One of the crucial questions to ask when analyzing data is if and how to set up the ETL process. ETL stands for Extract-Transform-Load, a technology used to read data from a database, transform it into another form and load it into another database. Although it sounds complicated for an average business user, it is quite simple for a data scientist. You don’t have to do all the database work, but an ETL service does it for you; it provides a useful tool to pull your data from external sources, conform it to demanded standards, and convert it into a destination data warehouse. These tools provide an effective solution since IT departments or data scientists don’t have to manually extract information from various sources, or you don’t have to become an IT specialist to perform complex tasks.
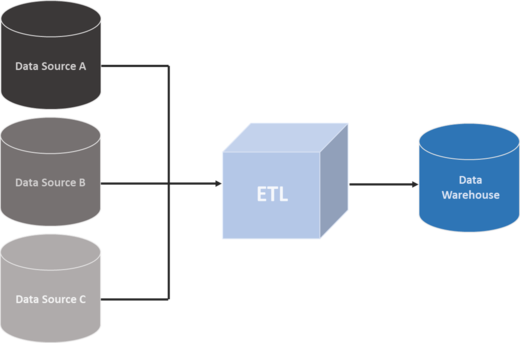
*ETL data warehouse*
If you have large data sets, and today most businesses do, it would be wise to set up an ETL service that brings all the information your organization is using and can optimize the handling of data.
9) What limitations will your analysis process have (if any)?
This next question is fundamental to ensure success in your analytical efforts. It requires you to put yourself in all the potential worst-case scenarios so you can prepare in advance and tackle them immediately with a solution. Some common limitations can be related to the data itself such as not enough sample size in a survey or research, lack of access to necessary technologies, and insufficient statistical power, among many others, or they can be related to the audience and users of the analysis such as lack of technical knowledge to understand the data.
No matter which of these limitations you might face, identifying them in advance will help you be ready for anything. Plus, it will prevent you from losing time trying to find a solution for an issue, something that is especially valuable in a business context in which decisions need to be made as fast as possible.
10) Who are the final users of your analysis results?
Another of the significant data analytics questions refers to the end-users of our analysis. Who are they? How will they apply your reports? You must get to know your final users, including:
- What they expect to learn from the data
- What their needs are
- Their technical skills
- How much time they can spend analyzing data?
Knowing the answers will allow you to decide how detailed your data report will be and what data you should focus on.
Remember that internal and external users have diverse needs. If the reports are designed for your own company, you more or less know what insights will be useful for your staff and what level of data complexity they can struggle through.
However, if your reports will also be used by external parties, remember to stick to your corporate identity. The visual reports you provide them with should be easy-to-use and actionable. Your final users should be able to read and understand them independently, with no IT support needed.
Also: think about the status of the final users. Are they junior members of the staff or part of the governing body? Every type of user has diverse needs and expectations.
11) How will the analysis be used?
Following on the latest point, after asking yourself who will use your analysis, you also need to ask yourself how you’re actually going to put everything into practice. This will enable you to arrange your reports in a way that transforms insight into action.
Knowing which questions to ask when analyzing data is crucial, but without a plan of informational action, your wonderfully curated mix of insights may as well be collecting dust on the virtual shelf. Here, we essentially refer to the end-use of your analysis. For example, when building reports, will you use it once as a standalone tool, or will you embed it for continual analytical use?
Embedded analytics is essentially a branch of BI technology that integrates professional dashboards or platforms into your business's existing applications to enhance its analytical scope and abilities. By leveraging the power of embedded dashboards, you can squeeze the juice out of every informational touchpoint available to your organization, for instance, by delivering external reports and dashboard portals to your external stakeholders to share essential information with them in a way that is interactive and easy to understand.
Another key aspect of considering how you’re going to use your reports is to understand which mediums will work best for different kinds of users. In addition to embedded reports, you should also consider whether you want to review your data on a mobile device, as a file export, or even printed to mull through your newfound insights on paper. Considering and having these options at your disposal will ensure your analytical efforts are dynamic, flexible, and ultimately more valuable.
The bottom line? Decide how you’re going to use your insights in a practical sense, and you will set yourself on the path to data enlightenment.
12) What data visualizations should you choose?
Your data is clean and your calculations are done, but you are not finished yet. You can have the most valuable insights in the world, but if they’re presented poorly, your target audience won’t receive the impact from them that you’re hoping for.
And we don’t live in a world where simply having the right data is the end-all, be-all. You have to convince other decision-makers within your company that this data is:
- Correct
- Important
- Urgent to act upon
Effective presentation aids in all of these areas. There are dozens of data charts to choose from and you can either thwart all your data-crunching efforts by picking the wrong data visualization (like displaying a time evolution on a pie chart) or give it an additional boost by choosing the right types of graphs.
There are a number of online data visualization tools that can get the hard work done for you. These tools can effectively prepare the data and interpret the outcome. Their ease of use and self-service application in testing theories, analyzing changes in consumer buying behavior, leverage data for analytical purposes without the assistance of analysts or IT professionals have become an invaluable resource in today’s data management practice.
By being flexible enough to personalize its features to the end-user and adjust to your prepared questions for analyzing data, the tools enable a voluminous analysis that can help you not to overlook any significant issue of the day or the overall business strategy.
Dynamic modern dashboards are far more powerful than their static counterparts. You can reach out and interact with the information before you while gaining access to accurate real-time data at a glance. With interactive dashboards, you can also access your insights via mobile devices with the swipe of a screen or the click of a button 24/7. This will give you access to every single piece of analytical data you will ever need.
13) What kind of software will help?
Continuing on our previous point, there are some basic and advanced tools that you can utilize. Spreadsheets can help you if you prefer a more traditional, static approach, but if you need to tinker with the data on your own, perform basic and advanced analysis on a regular basis, and have real-time insights plus automated reports, then modern and professional tools are the way to go.
With the expansion of business intelligence solutions, data analytics questions to ask have never been easier. Powerful features such as basic and advanced analysis, countless chart types, quick and easy data source connection, and endless possibilities to interact with the data as questions arise, enable users to simplify oftentimes complex processes. No matter the analysis type you need to perform, the designated software will play an essential part in making your data alive and "able to speak."
Moreover, modern software will not require continuous manual updates of the data but it will automatically provide real-time insights that will help you answer critical questions and provide a stable foundation and prerequisites for good analysis.
Try our professional data analysis software for 14 days, completely free!
14) What advanced technologies do you have at your disposal?
When you're deciding on which analysis question to focus on, considering which advanced or emerging technologies you have at your disposal is always essential.
By working with the likes of artificial intelligence (AI), machine learning (ML), and predictive analytics, you will streamline your data questions analysis strategies while gaining an additional layer of depth from your information.
The above three emerging technologies are interlinked in the sense that they are autonomous and aid business intelligence (BI) across the board. Using AI technology, it’s possible to automate certain data curation and analytics processes to boost productivity and hone in on better-quality insights.
By applying ML innovations, you can make your data analysis dashboards smarter with every single action or interaction, creating a self-improving ecosystem where you consistently boost the efficiency as well as the informational value of your analytical efforts with minimal human intervention.
From this ecosystem will emerge the ability to utilize predictive analytics to make accurate projections and develop organizational strategies that push you ahead of the competition. Armed with the ability to spot visual trends and patterns, you can nip any emerging issues or inefficiencies in the bud while playing on your current strengths for future gain.
With datapine, you can leverage the power of autonomous technologies by setting up data alerts that will notify you of a variety of functions - the kind that will help you exceed your business goals, as well as identify emerging patterns and particular numeric or data-driven thresholds. These BI features armed with cutting-edge technology will optimize your analytical activities in a way that will foster innovation and efficiency across the business.
15) How regularly should you check your data?
Once you’ve answered all of the previous questions you should be 80% on the right track to be successful with your analytical efforts. That being said, data analytics is a never-ending process that requires constant monitoring and optimization. This leads us to our next question: how regularly should you check your data?
There is no correct answer to this question as the frequency will depend on the goals of your analysis and the type of data you are tracking. In a business setting, there will be reports that contain data that you’ll need to track on a daily basis and in real-time since they influence the immediate performance of your organization for example, the marketing department might want to track the performance of their paid campaigns on a daily basis to optimize them and make the most out of their marketing budget.
Likewise, there are other areas that can benefit from monthly tracking to extract more in-depth conclusions. For example, the customer service team might want to track the number of issues by channel on a monthly basis to identify patterns that can help them optimize their service.
Modern data analysis tools provide users with the ability to automatically update their data as soon as it is generated. This alleviates the pain of having to manually check the data for new insights while significantly reducing the risk of human error. That said, no matter what frequency of monitoring you choose, it is also important to constantly check your data and analytical strategies to see if they still make sense for the current situation of the business. More on this in the next question.
16) What else do you need to know?
Before finishing up, one of the crucial questions to ask about data analytics is how to verify the results. Remember that statistical information is always uncertain even if it is not reported in that way. Thinking about which information is missing and how you would use more information if you had it could be one point to consider. That way you can identify potential information that could help you make better decisions. Keep also in mind that by using simple bullet points or spreadsheets, you can overlook valuable information that is already established in your business strategy.
Always go back to the original objectives and make sure you look at your results in a holistic way. You will want to make sure your end result is accurate and that you haven’t made any mistakes along the way. In this step, important questions for analyzing data should be focused on:
- Does is it make sense on a general level?
- Are the measures I’m seeing in line with what I already know about the business?
Your end result is equally important as your process beforehand. You need to be certain that the results are accurate, verify the data, and ensure that there is no space for big mistakes. In this case, there are some data analysis types of questions to ask such as the ones we mentioned above. These types of questions will enable you to look at the bigger picture of your analytical efforts and identify any points that need more adjustments or additional details to work on.
You can also test your analytical environment against manual calculations and compare the results. If there are extreme discrepancies, there is something clearly wrong, but if the results turn accurate, then you have established a healthy data environment. Doing such a full-sweep check is definitely not easy, but in the long term, it will bring only positive results. Additionally, if you never stop questioning the integrity of your data, your analytical audits will be much healthier in the long run.
17) How can you create a data-driven culture?
Dirty data is costing you.
Whether you are a small business or a large enterprise, the data tell its story, and you should be able to listen. Preparing questions to ask about data analytics will provide a valuable resource and a roadmap to improved business strategies. It will also enable employees to make better departmental decisions and, consequently, create a cost-effective business environment that can help your company grow. Dashboards are a great way to establish such a culture, like in our financial dashboard example below:
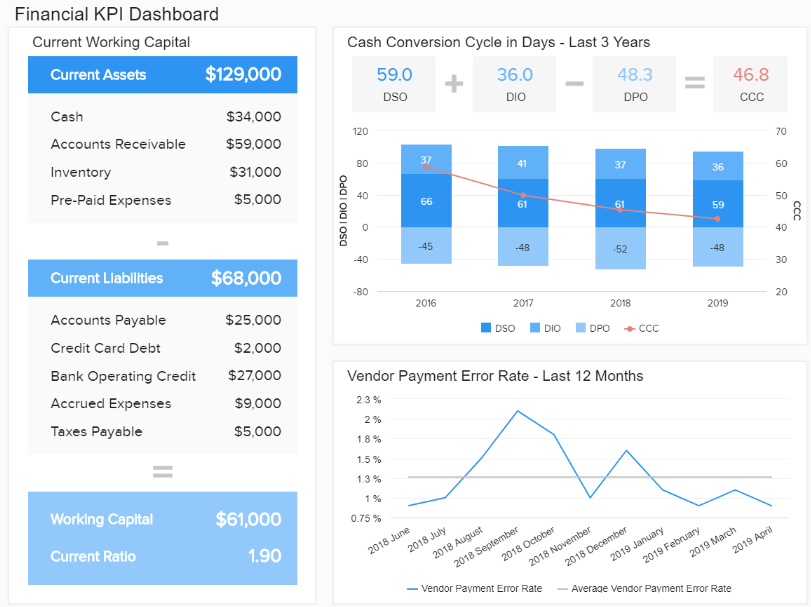
**click to enlarge**
In order to truly incorporate this data-driven approach to running the business, all individuals in the organization, regardless of the department they work in, need to know how to start asking the right data analytics questions.
They need to understand why it is important to conduct data analysis in the first place.
However, simply wishing and hoping that others will conduct data analysis is a strategy doomed to fail. Frankly, asking them to use data analysis (without showing them the benefits first) is also unlikely to succeed.
Instead, lead by example. Show your internal users that the habit of regular data analysis is a priceless aid for optimizing your business performance. Try to create a beneficial dashboard culture in your company.
Data analysis isn’t a means to discipline your employees and find who is responsible for failures, but to empower them to improve their performance and self-improve.
18) Are you missing anything, and is the data meaningful enough?
Once you’ve got your data analytics efforts off the ground and started to gain momentum, you should take the time to explore all of your reports and visualizations to see if there are any informational gaps you can fill.
Hold collaborative meetings with department heads and senior stakeholders to vet the value of your KPIs, visualizations, and data reports. You might find that there is a particular function you’ve brushed over or that a certain piece of data might be better displayed in a different format for greater insight or clarity.
Making an effort to keep track of your return on investment (ROI) and rates of improvements in different areas will help you paint a panoramic picture that will ultimately let you spot any potential analytical holes or data that is less meaningful than you originally thought.
For example, if you’re tracking sales targets and individual rep performance, you will have enough information to make improvements to the department. But with a collaborative conversation and a check on your departmental growth or performance, you might find that also throwing customer lifetime value and acquisition costs into the mix will offer greater context while providing additional insight.
While this is one of the most vital ongoing data analysis questions to ask, you would be amazed at how many decision-makers overlook it: look at the bigger picture, and you will gain an edge on the competition.
19) How can you keep improving the analysis strategy?
When it comes to business questions for analytics, it’s essential to consider how you can keep improving your reports, processes, or visualizations to adapt to the landscape around you.
Regardless of your niche or sector, in the digital age, everything is in constant motion. What works today may become obsolete tomorrow. So, when prioritizing which questions to ask for analysis, it’s vital to decide how you’re going to continually evolve your reporting efforts.
If you’ve paid attention to business questions for data analysis number 18 (“Am I missing anything?” and “Is my data meaningful enough?”), you already have a framework for identifying potential gaps or weaknesses in your data analysis efforts. To take this one step further, you should explore every one of your KPIs or visualizations across departments and decide where you might need to update particular targets, modify your alerts, or customize your visualizations to return insights that are more relevant to your current situation.
You might, for instance, decide that your warehouse KPI dashboard needs to be customized to drill down further into total on-time shipment rates due to recent surges in customer order rates or operational growth.
There is a multitude of reasons you will need to tweak or update your analytical processes or reports. By working with the right BI technology while asking yourself the right questions for analyzing data, you will come out on top time after time.
Try our professional data analysis software for 14 days, completely free!
Start Your Analysis Today!
We just outlined a 19-step process you can use to set up your company for success through the use of the right data analysis questions.
With this information, you can outline questions that will help you to make important business decisions and then set up your infrastructure (and culture) to address them on a consistent basis through accurate data insights. These are good data analysis questions and answers to ask when looking at a data set but not only, as you can develop a good and complete data strategy if you utilize them as a whole. Moreover, if you rely on your data, you can only reap benefits in the long run and become a data-driven individual, and company.
To sum it up, here are the most important data questions to ask:
- What exactly do you want to find out?
- What standard KPIs will you use that can help?
- Where will your data come from?
- Will you use market benchmarks?
- Is your data in need of cleaning?
- How can you ensure data quality?
- Which statistical analysis techniques do you want to apply?
- What ETL procedures need to be developed (if any?)
- What limitations will your analysis process have (if any)?
- Who are the final users of your analysis results?
- How will your analysis be used?
- What data visualization should you choose?
- What kind of software will help?
- What advanced technologies do you have at your disposal?
- What else do you need to know?
- How regularly should you check your data?
- How can you create a data-driven culture?
- Are you missing anything, and is the data meaningful enough?
- How can you keep improving the analysis strategy?
Weave these essential data analysis question examples into your strategy, and you will propel your business to exciting new heights.
To start your own analysis, you can try our software for a 14-day trial - completely free!