Introduction
In our previous blogs, we looked at the phenomenon of “low-volatility anomaly”, the outperformance of low volatility as a factor in stocks in Chile (with and without trading costs) and the LatAm markets. The results showed that low-volatility anomaly exists in these markets, offering outperformance against benchmarks. In this blog, we extend the analysis to the Canadian equity markets and find the existence of a “low-volatility anomaly”.
The Canadian ETF market has been vibrant. In June 2021, total AUM stood at USD 286 billion, of which USD 182 billion (65%) was invested in equity-based ETFs. While the majority of the ETFs are based on market-cap indexes, the share of smart beta (factor) indexes has as grown to about 18%, amounting to USD 33 billion. It is interesting to note that investment in ETFs is smaller by a factor of 7 relative to the Canadian mutual fund assets with an AUM of $1.9 trillion.
Both the fund management industry and the financial advisory business have smart beta products in their portfolios, and there is scope to enhance these further. As per the 2018 FTSE Russell advisor survey, only 35% of advisors are ‘very familiar’ with the smart beta strategies. More than half of financial advisors surveyed in Canada and the UK plan to increase their use of these strategies. This blog aims to contribute to the understanding of factor investing, in particular of the volatility factor, in the Canadian markets.
Evalueserve’s Canada Low-Volatility Price Return Index
For our analysis, we developed an in-house index called Evalueserve’s Canada Low-Volatility Price Return Index (EVCALWVPR). The rule set is as follows:
- Index Universe
- Constituents of the S&P TSX 60 Index (SPTSX60), the most popular large-cap benchmark index in Canada
- Selection
- The index selection consists of the bottom 20% (12 stocks) least-volatile stocks from the universe, based on volatility shown over the previous quarter. Volatility is measured as a standard deviation of daily returns annualized using 252 business days.
- Weighting
- Inversely proportional to volatility
- Rebalancing
- Quarterly
Index modeling used Python programming language to define stock eligibility, find the least-volatile stocks, define their weight, and calculate index levels.
Performance of the EVCALWVPR Index vs. the Benchmark SPTSX60 Index
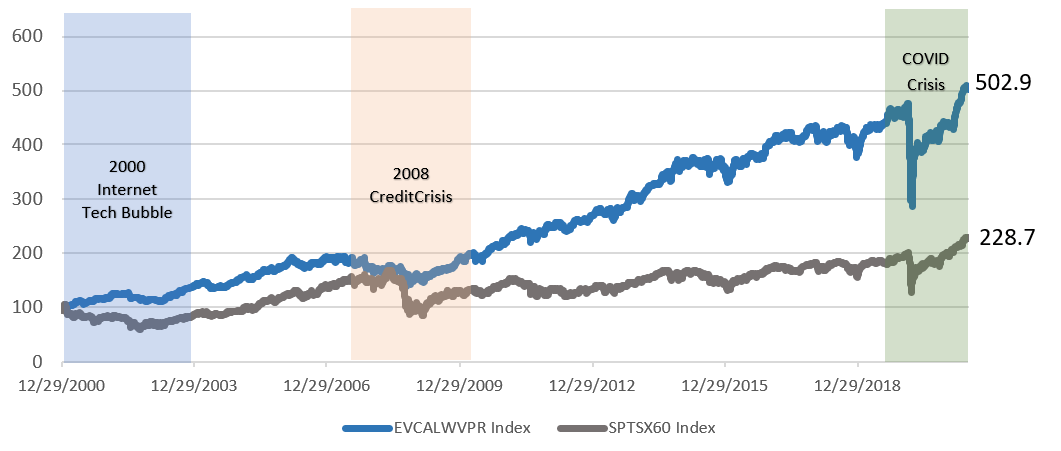
The EVCALWVPR Index outperformed the benchmark SPTSX60 Index by 274.2% during the period 12/29/2000 to 06/30/2021 (refer to the figure below). The terminal value for the EVCALWVPR Index was 502.9 compared to 228.7 for the SPTSX60 Index.
Figure 1. EVS Canada Low Volatility Index vs. S&P TSX 60 Index (12/29/2000 to 06/30/2021)
 The performance metrics in the following table show that the EVCALWVPR Index had an annualized outperformance of 4.1% vs. the SPTSX60 Index. Relative to the benchmark, the EVCALWVPR Index had a positive alpha, a low beta, and medium correlation. The EVCALWVPR Index also fared better on all the parameters studied, including maximum drawdown and upside capture relative to downside capture. Presence of low-volatility stocks reduced the volatility of the EVCALWVPR Index to 10% vs. 13.5% for the benchmark index and also helped deliver higher Sharpe and Sortino ratios. These results, therefore, confirm the existence of low-volatility anomaly, i.e., investments with lower risk have better returns than those with higher risk.
Table 1. Performance Metrics (based on monthly returns): 12/9/2000 to 06/30/2021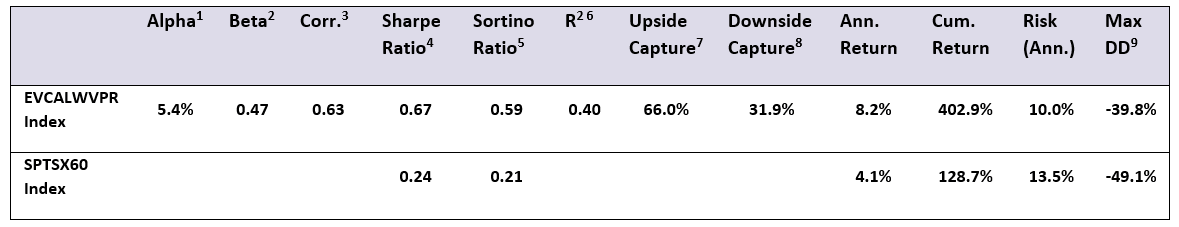
Sub-period Analysis
To check for time consistency in the performance of the EVCALWVPR Index, we split the analysis period in two sub-periods, approximately a decade each (Sub-Period 1: January 2001 to December 2010 and Sub-Period 2: January 2011 to June 2021). The first sub-period covers market events like the Tech Bubble and the Credit Crisis, while the second period was less eventful, except for the COVID-19 pandemic.
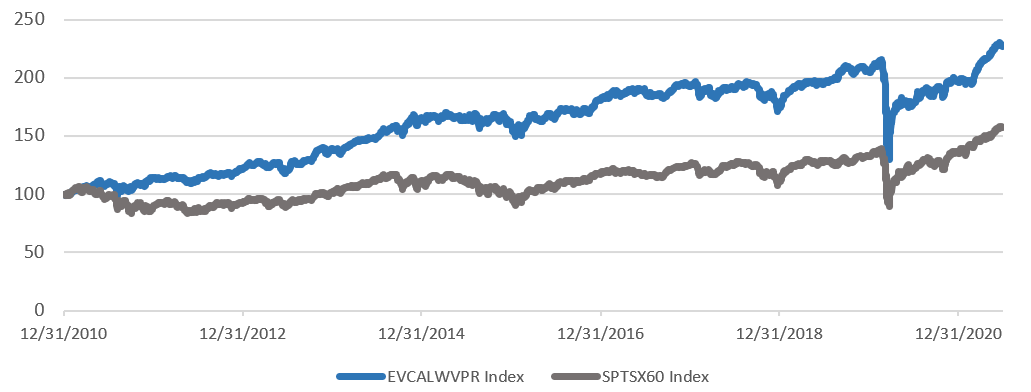
The two charts below show that the EVCALWVPR Index outperformed the benchmark SPTSX60 Index during each of the two sub-periods analyzed. Outperformance was 76.1% and 69.8% during the first and second sub-period, respectively.
Figure 2. EVCALWVPR Index vs. SPTSX60 Index Sub-Period 1: 12/29/2000 to 12/31/2010
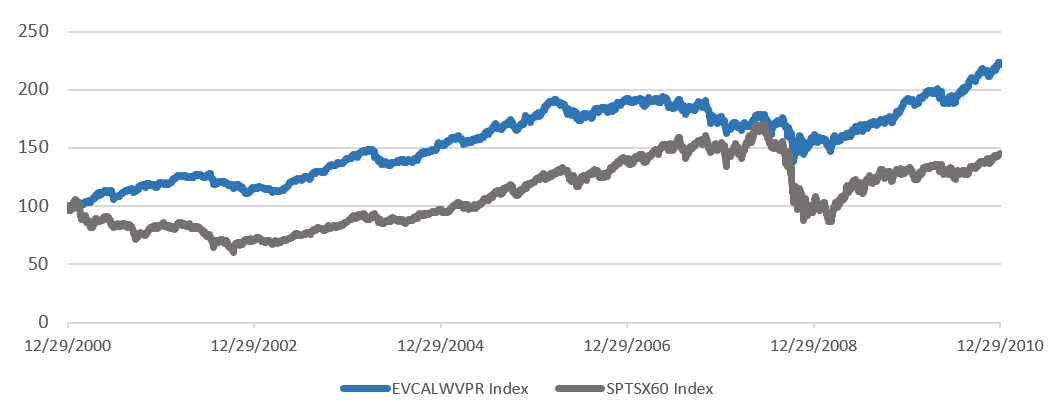
Figure 3. EVCALWVPR Index vs. SPTSX60 Index Sub-Period 2: 12/31/2010 to 06/30/2021
 The performance metrics for the sub-periods in the tables below indicate the EVCALWVPR Index had a better positive alpha relative to the benchmark. The EVCALWVPR Index fared better on all the parameters studied in both the sub-periods, except for a slightly higher maximum drawdown in Sub-period 2.
Table 2. Performance Metrics (based on monthly returns) Sub-Period 1: 12/29/2000 to 12/31/2010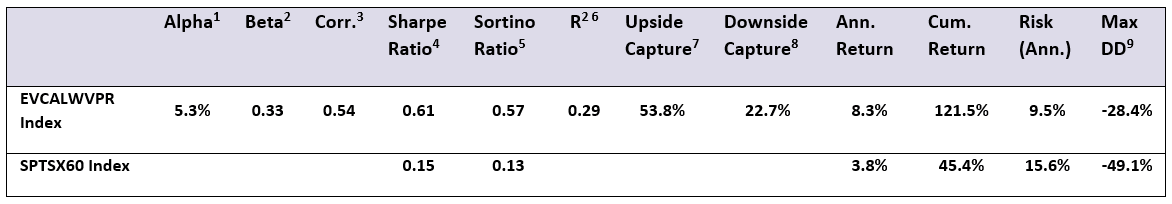
Table 3. Performance Metrics (based on monthly returns) Sub-Period 2: 12/31/2010 to 06/30/2021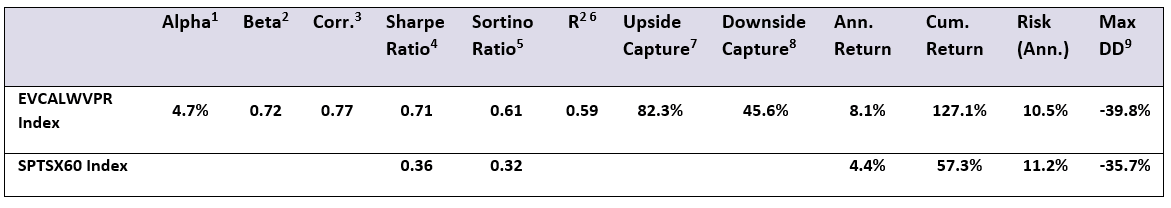
Crisis vs. Non-Crisis Period Analysis
The argument for low-volatility anomaly belies the expectation that a low-volatility strategy will fall and rise less than the benchmark. We evaluate the behavior of the EVCALWVPR Index further by dividing the period of analysis into crisis and non-crisis periods.
The EVCALWVPR Index performed better during the two crisis periods ꟷ the Internet Tech Bubble of 2000 and the 2008 Credit Crisis. The EVCALWVPR Index also performed better than the benchmark during the non-crisis periods, with an average monthly return of 0.95% compared to the 0.85% for the benchmark.
Table 4. Average Monthly Return During Crisis and Non-Crisis Periods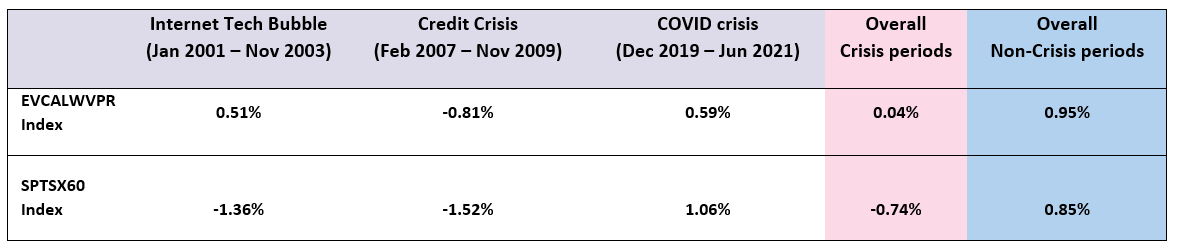
Conclusion
Our analysis confirms the existence of low-volatility anomaly in the Canadian markets, in line with the other global markets. Financial advisors and ETF providers can benefit from this finding as they develop new indexes and ETF products.
Evalueserve’s Index & Quant division works with financial services clients to support their new index development by offering research services for novel investment products, index calculation, and production services.
Reference Notes:
- Figure 1, 2, 3: Returns do not reflect management fees, transaction costs, or expenses. Indices are unmanaged and cannot be invested indirectly. Past performance does not guarantee future results. Index returns are for illustrative purposes only. Benchmark SPTSX60 Index rebased to 100 as of the start date.
- Table 1, 2, 3: 1 Alpha: A measure of performance on a risk-adjusted basis. The excess return relative to benchmark. 2 Beta: A measure of the volatility, or systematic risk, relative to the benchmark. 3 Correlation: A statistical measure of how the SPTSX60 Index and the respective index move in relation to each other. Calculated based on monthly returns. 4 Sharpe Ratio: A measure of risk-adjusted performance. 5 Sortino Ratio: A modification of the Sharpe Ratio that focuses on the volatility of negative returns 6 R2: Calculated based on annual returns. 7 Upside Capture: A measure of performance relative to the SPTSX60 INDEX during periods of positive returns for the benchmark. Based on monthly returns. 8 Downside Capture: A measure of performance relative to the SPTSX60 INDEX during periods of negative returns for the benchmark. Based on monthly returns. 9 Maximum Drawdown: The maximum observed loss from peak to trough of a portfolio based on daily index levels.